- MathNotebook
- MathConcepts
- StudyMath
- Geometry
- Logic
- Bott periodicity
- CategoryTheory
- FieldWithOneElement
- MathDiscovery
- Math Connections
Epistemology
- m a t h 4 w i s d o m - g m a i l
- +370 607 27 665
- My work is in the Public Domain for all to share freely.
- 读物 书 影片 维基百科
Introduction E9F5FC
Questions FFFFC0
Software
Presented at the workshop Logic for Children at the 6th World Congress on Universal Logic, June 21-26, Vichy, France.
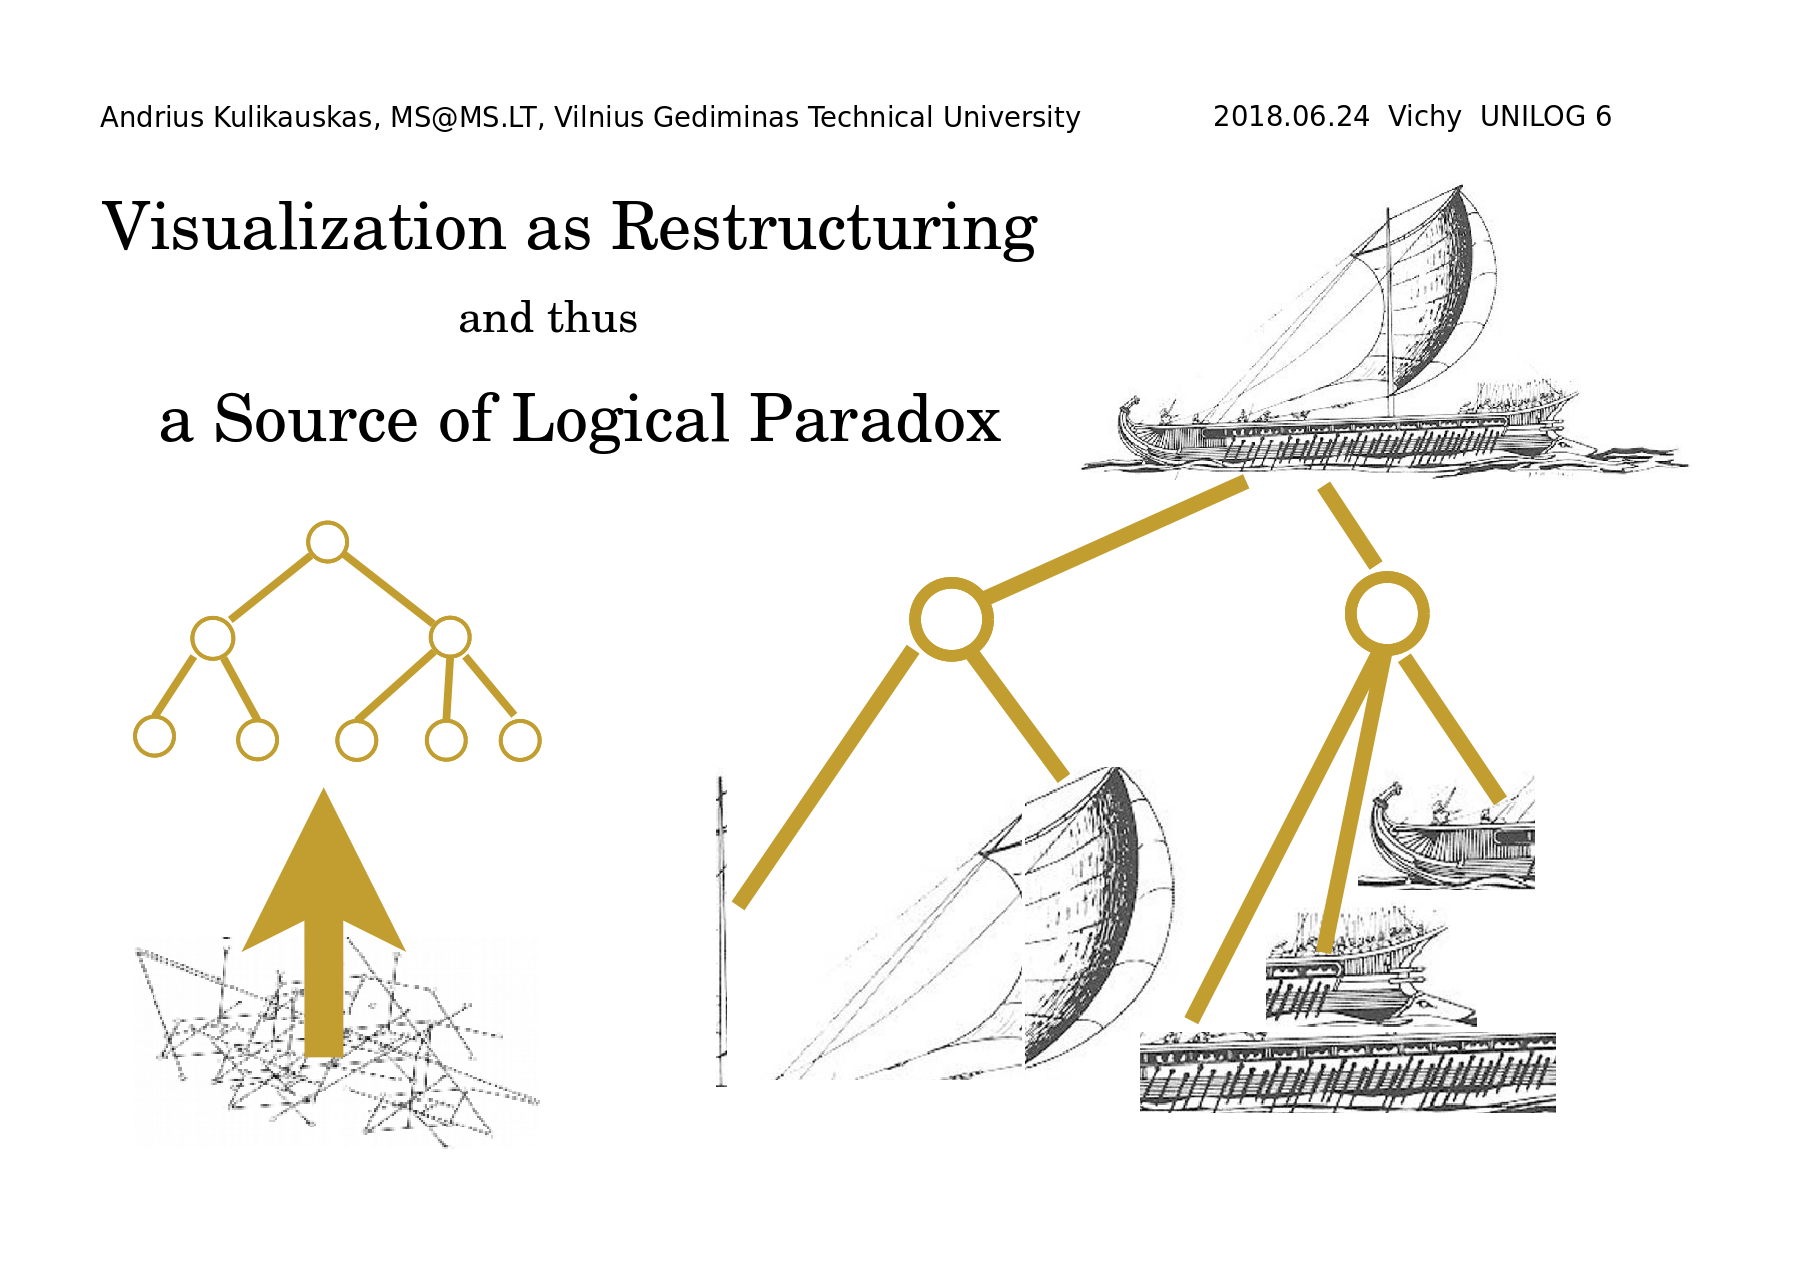
Visualization as Restructuring and thus a Source of Logical Paradox
I will overview and systematize the ways our minds organize and visualize thoughts. This is very much related to the various ways we use diagrams. However, I will not focus on the diagrams themselves, but rather on the ways that our minds interpret them. I will note how each different way of visualizing thoughts generates an associated logical paradox. I will also point out where these ways of thinking arise in the Unified Modeling Language, the properties of complex adaptive systems, and the axioms of Zermelo-Fraenkel set theory.
I thank Eduardo Ochs for organizing this workshop, "Logic for Children". I share the purpose of trying to capture the essence of this activity, as we might with "Basketball for Children", "Guitar for Children" or "God for Children". I wish to contribute the idea that the childlike perspective is actually the most general perspective, the one which makes the least assumptions. It is grounded in the most abstract mind, and leverages its conceptual limits, which I believe are familiar to all of us since our days in the womb. The child's perspective, the learner's perspective, starts from the abstract and asks how to make it concrete, whereas the adult's perspective, the expert's perspective, starts with the concrete and asks how to make it more abstract.
In my investigation, at times I collect examples from real life and try to classify them, and at times I systematize those classes and explore the real life implications. Thus I alternate between induction and deduction, that is, between documentation and derivation. I find that such a study of cognition is yielding fruitful ideas regarding logic and math.
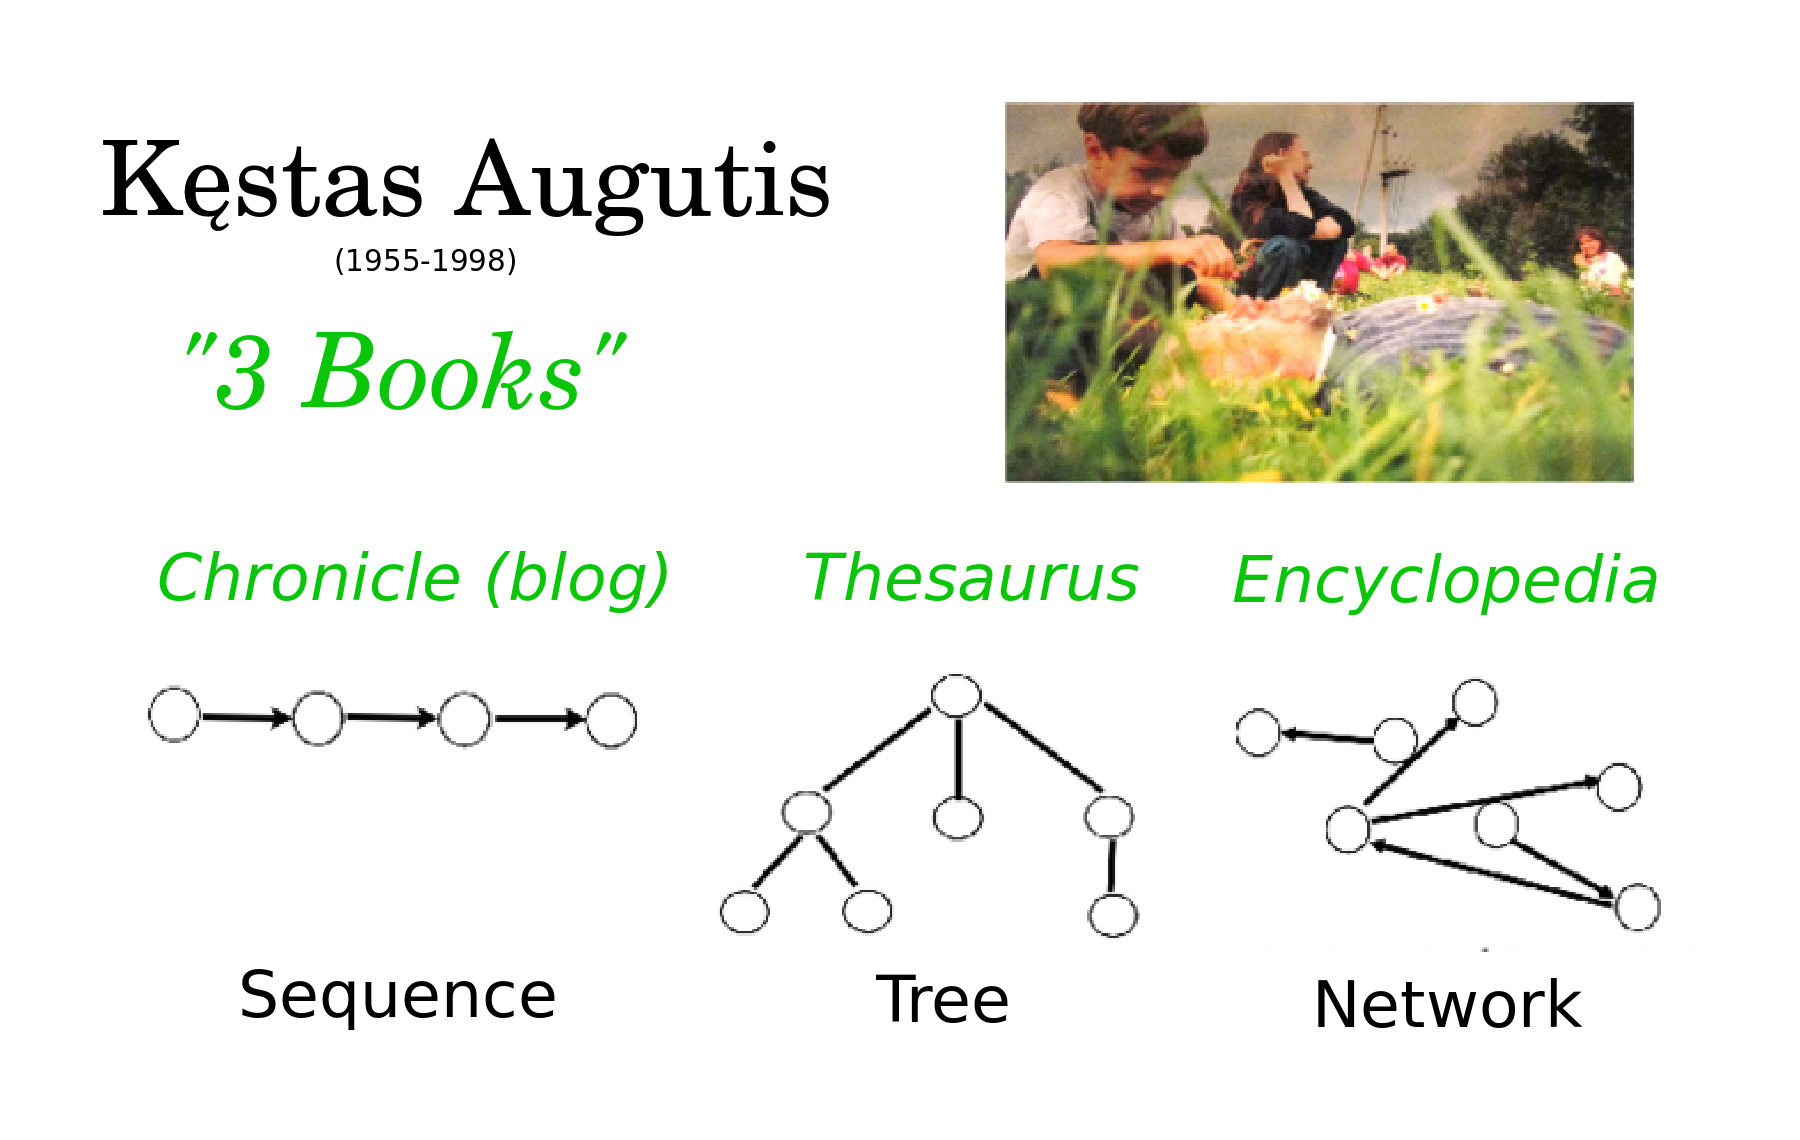
In 1998, I was inspired by educator Kęstas Augutis's vision that every high school student be required to write three books (a chronicle, a thesaurus, and an encyclopedia) so as to master three kinds of thinking (sequential, hierarchical, and network). A student's thoughts or concepts, their paragraphs or articles, may be thought of as structural nodes, which get additional meaning from their structural context, that is, their relationships with other nodes, whether they are part of a sequence, a tree or a network.
I became interested to design software for organizing thoughts in these three different ways. Implementing such a design forced me to consider specific questions, and doubly so, because I aspired to model our mind's natural way of thinking. Can there be multiple sequences, trees and networks? Can they overlap with each other? Can there be multiple links between thoughts? Are all of the links directed or may they be undirected? Does a tree necessarily have a root? Can the branches of a tree be ordered or not? May they be ordered linearly or radially? Can the links be thoughts in their own right?
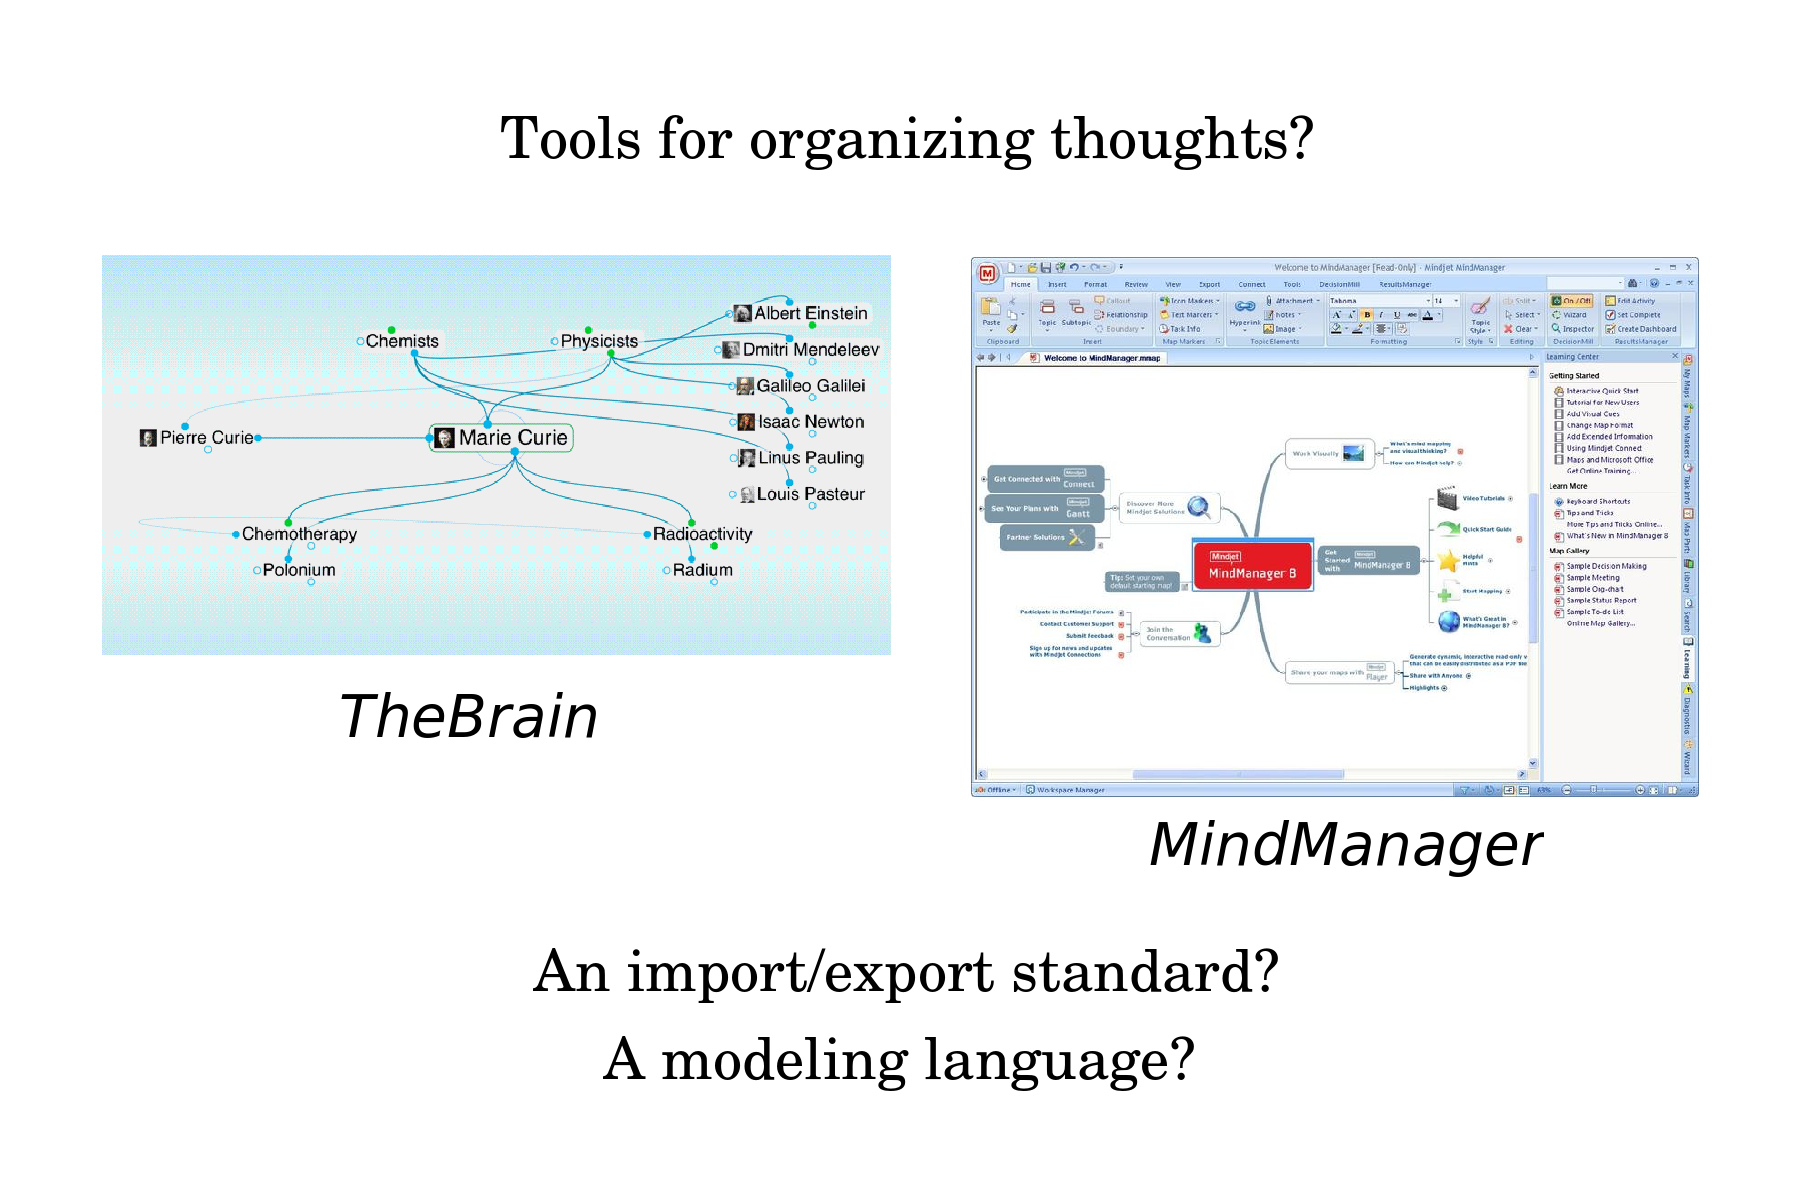
I realized that I should survey existing software tools for organizing thoughts. One such tool was Mind Manager, which supported mind mapping, in which a central thought is the root of a tree which extends with peripheral thoughts in all directions. Another tool was TheBrain, where each thought can appear at the center of the screen, revealing its parents, children and siblings in a hierarchy, and also its fellows in a network. Soon enough, I became more interested in developing an import-export standard, a modeling language, which would foster a thriving ecosystem of tools that provided different views for working with the same thoughts.
I wondered, are there other basic structures besides sequences, trees and networks? And what exactly should I mean by sequences, trees and networks? A tree may be thought of as a network, and a sequence may be thought of as a tree, yet does the mind distinguish them all qualitatively? I investigated by collecting about sixty examples of how we organize thoughts and things, and considered especially, how we visualize in our minds whatever is organized.
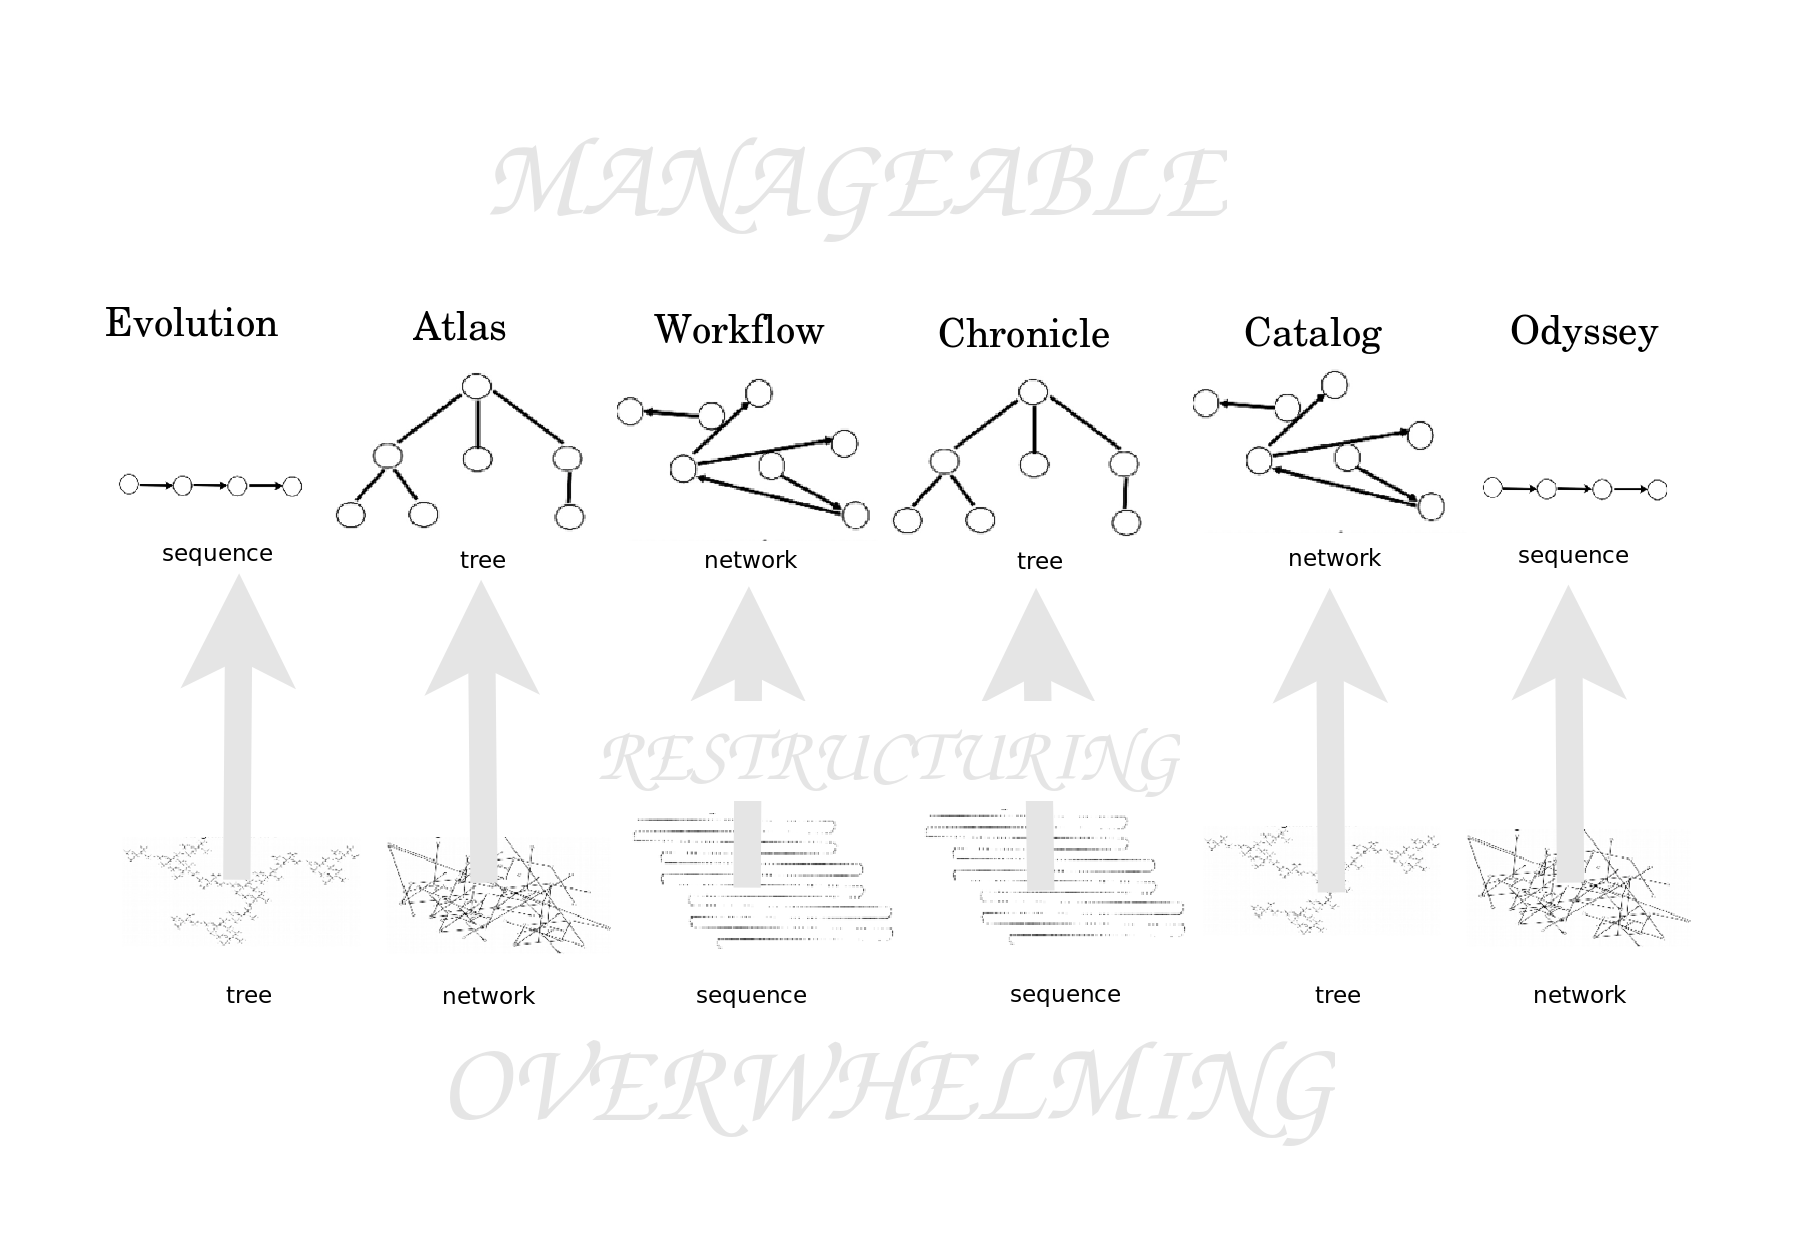
I was surprised to realize that our imaginations, in visualizing, never use sequences, trees or networks in isolation. Instead, we use these structures in pairs, as follows:
- Evolution: A tree (of variations) is restructured with a sequence (of times).
- Atlas: A network (of adjacency relations) is restructured with a tree (of global and local views).
- Workflow: A sequence (of instructions) is restructured with a network (of loops and branches).
- Chronicle: A sequence (of events in time) is restructured with a tree (of time periods).
- Catalog: A tree (of concepts) is restructured with a network (of cross-links).
- Odyssey: A network (of states) is restructured with a sequence (of steps).
In general, a first, large, comprehensive structure grows so overwhelmingly robust that we restructure it with a second, different, smaller, manageable structure of multiple vantage points. And in those cases where a small diagram is useful, as in category theory, then even so, our mind visualizes it by restructuring it, that is, by walking through it, as with an odyssey, or by considering it in the context of other structures, as with an atlas.
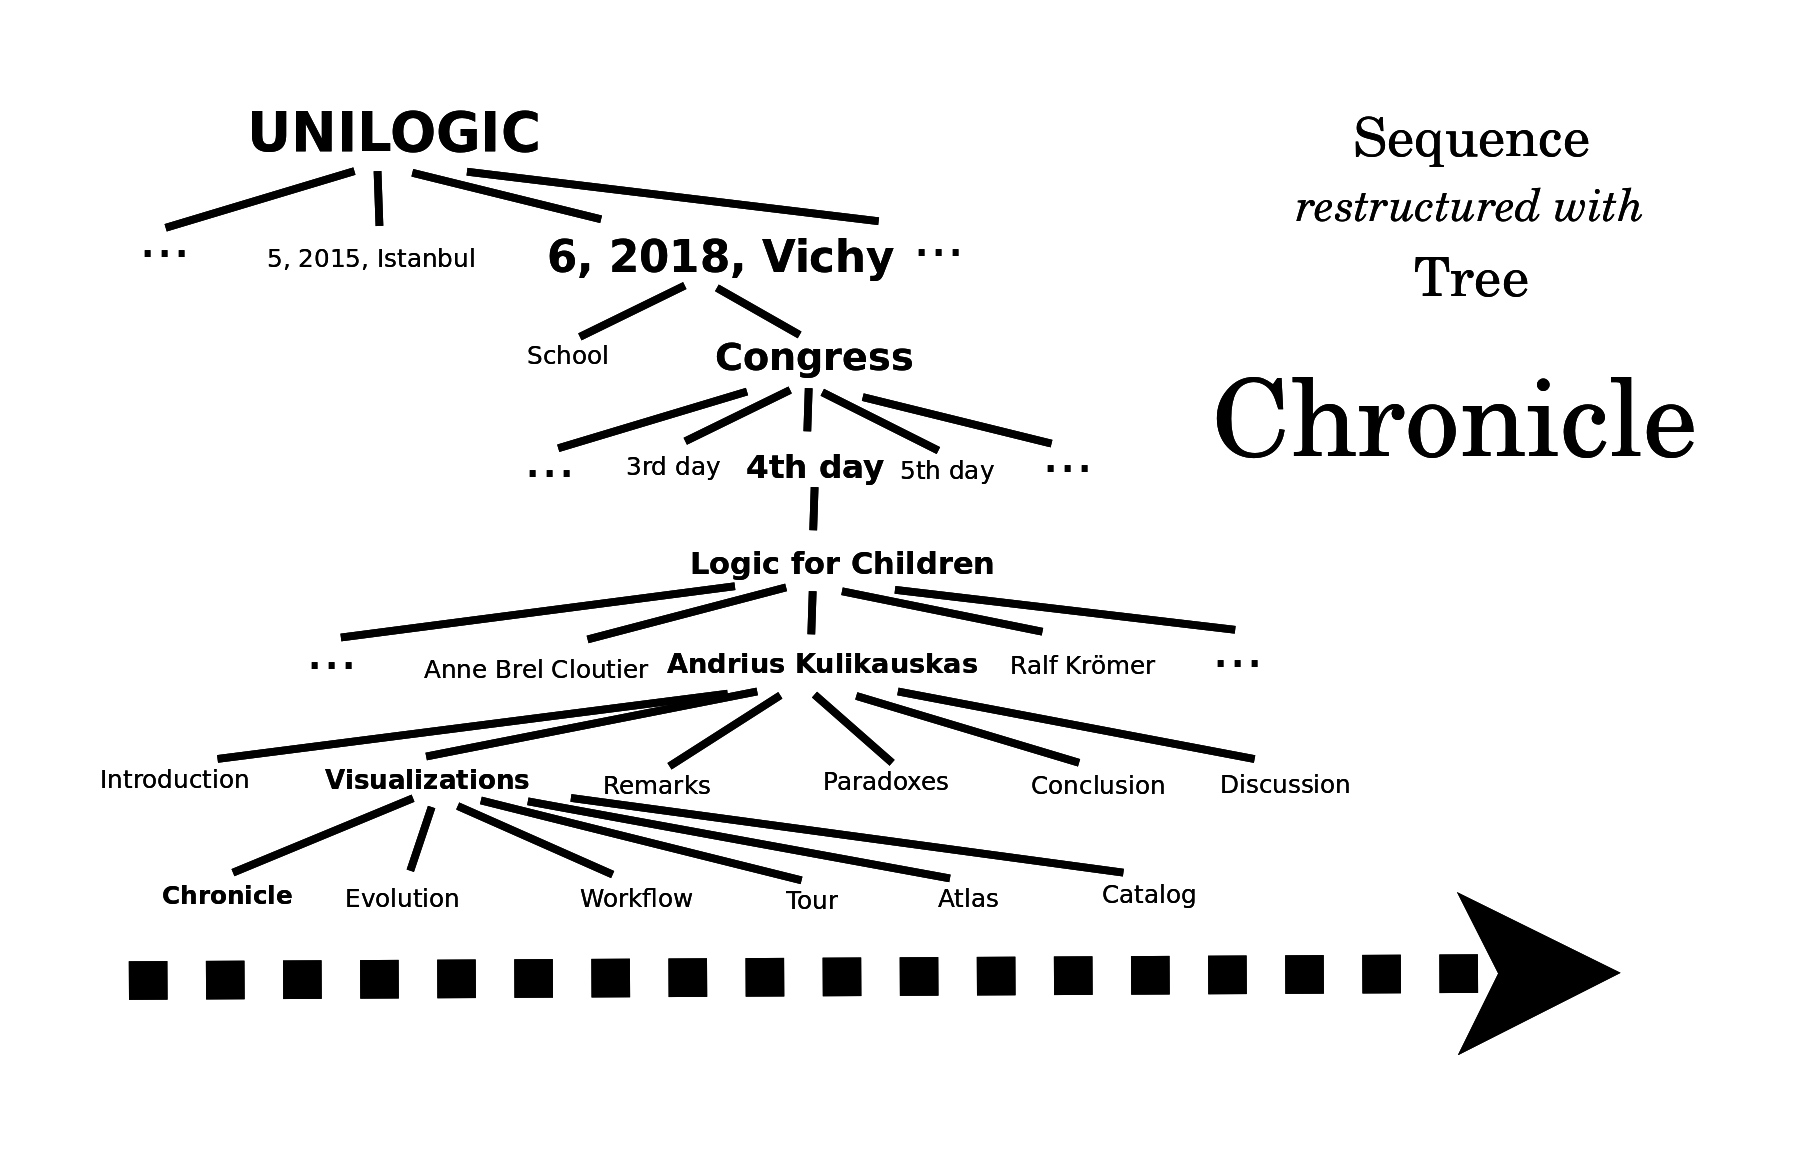
A sequence of three or four slides is not interesting. But when I have twenty slides, it has grown unmanageable, and so I restructure it with a tree of time periods. I introduced my talk and am now showing you slides of six visualizations - chronicle, evolution, workflow, odyssey, atlas and catalog - and then after some remarks I will show you related paradoxes. And in this way, with a chronicle, we can organize thousands of slides, including those of Anne before me and Ralf after me, of the successive workshops, the days of the congress, and so on.
I note that, in fact, there are multiple workshops taking place at the same time. If I insisted on focusing on this fact, then my mind would let go of the chronicle and take up a different visualization, such as a workflow. Instead, my mind downplays this fact and simply acknowledges the violation while continuing to visualize the chronicle. This example shows how the mind switches back and forth amongst a limited number of visualizations.
My mind recognizes a chronicle whenever an underlying sequence is restructured with a tree, as with a table of contents, a parade, the Dewey decimal system for libraries, and the decimal notation for the whole numbers.
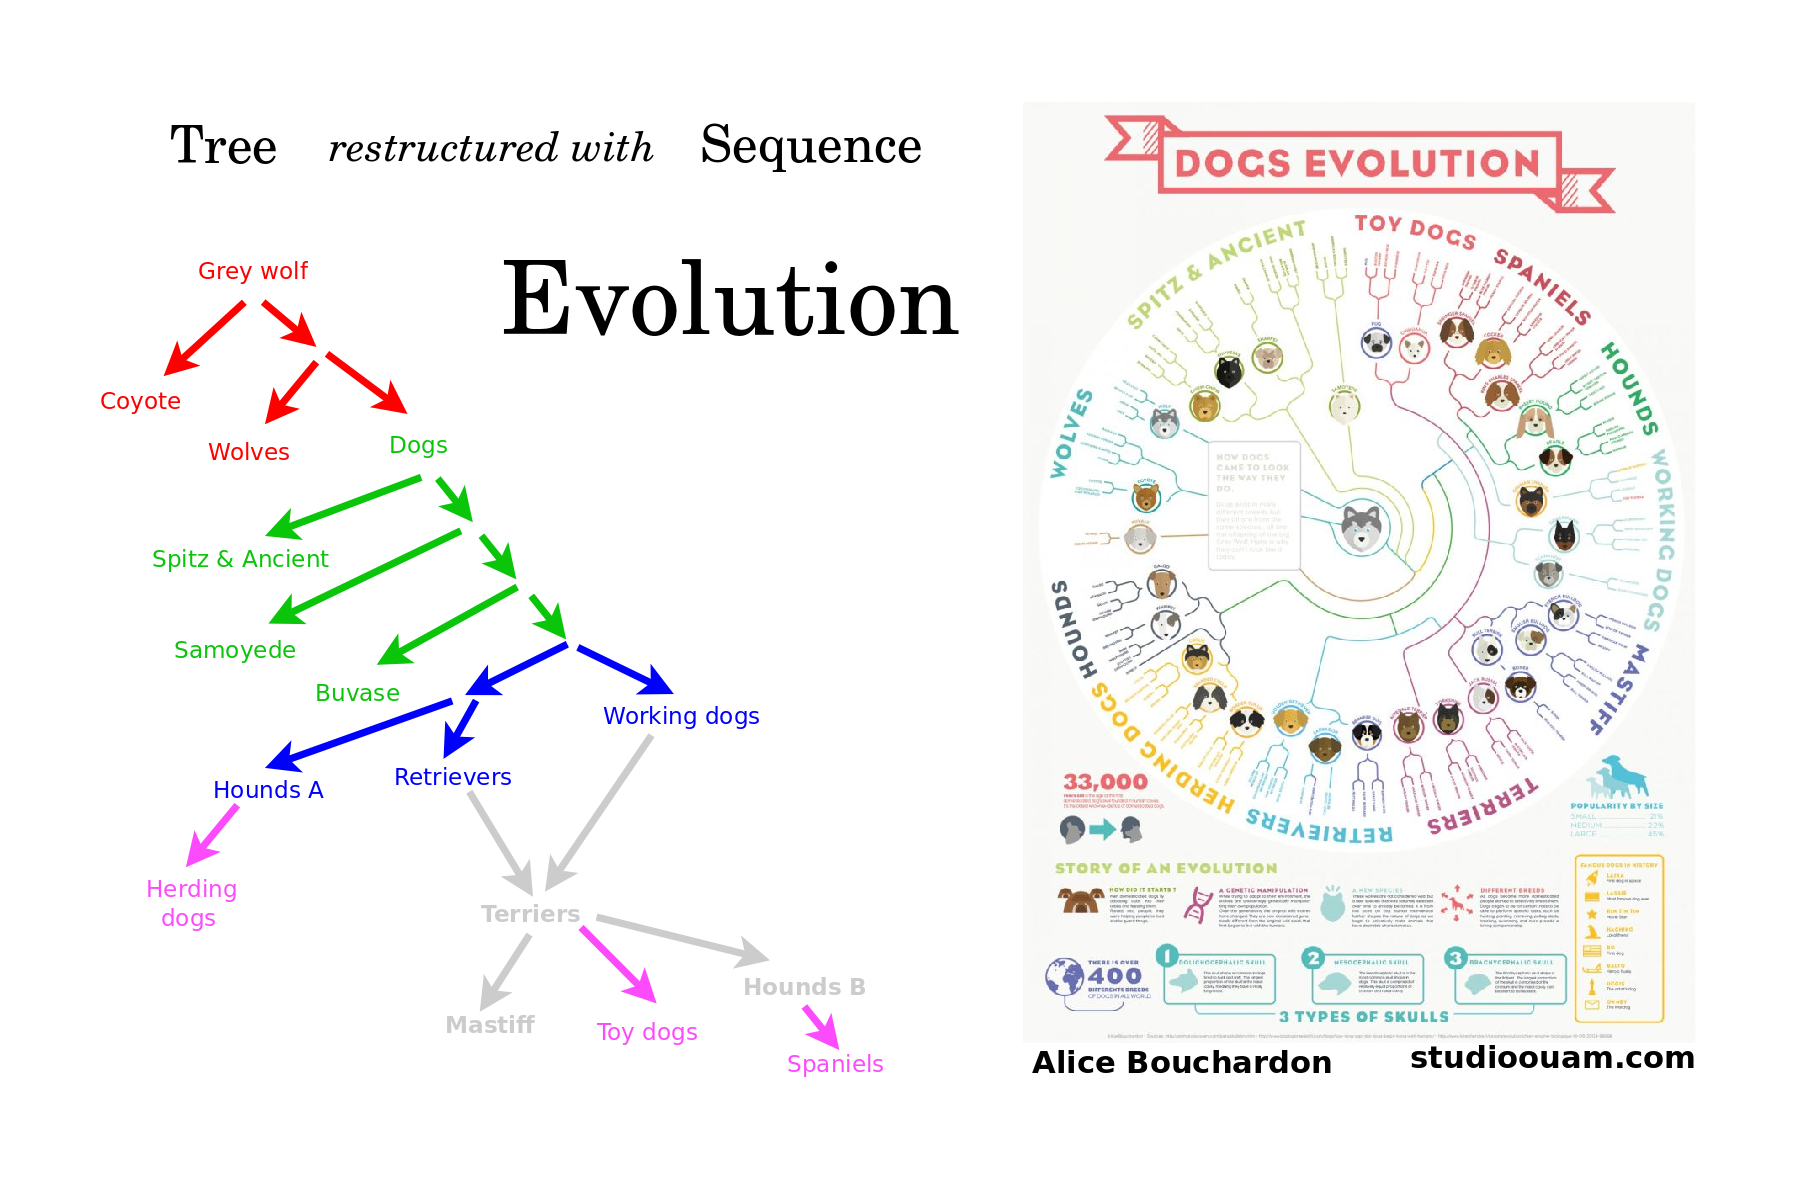
My mind recognizes an evolution whenever an underlying tree is restructured with a sequence, as with the origin of species, a knockout tournament, an encyclopedia of chess openings, a dictionary in alphabetical order, and the decimal notation for the real numbers from 0 to 1.
This diagram of dog evolution has a violation due to interbreeding, which again, the mind can gloss over.
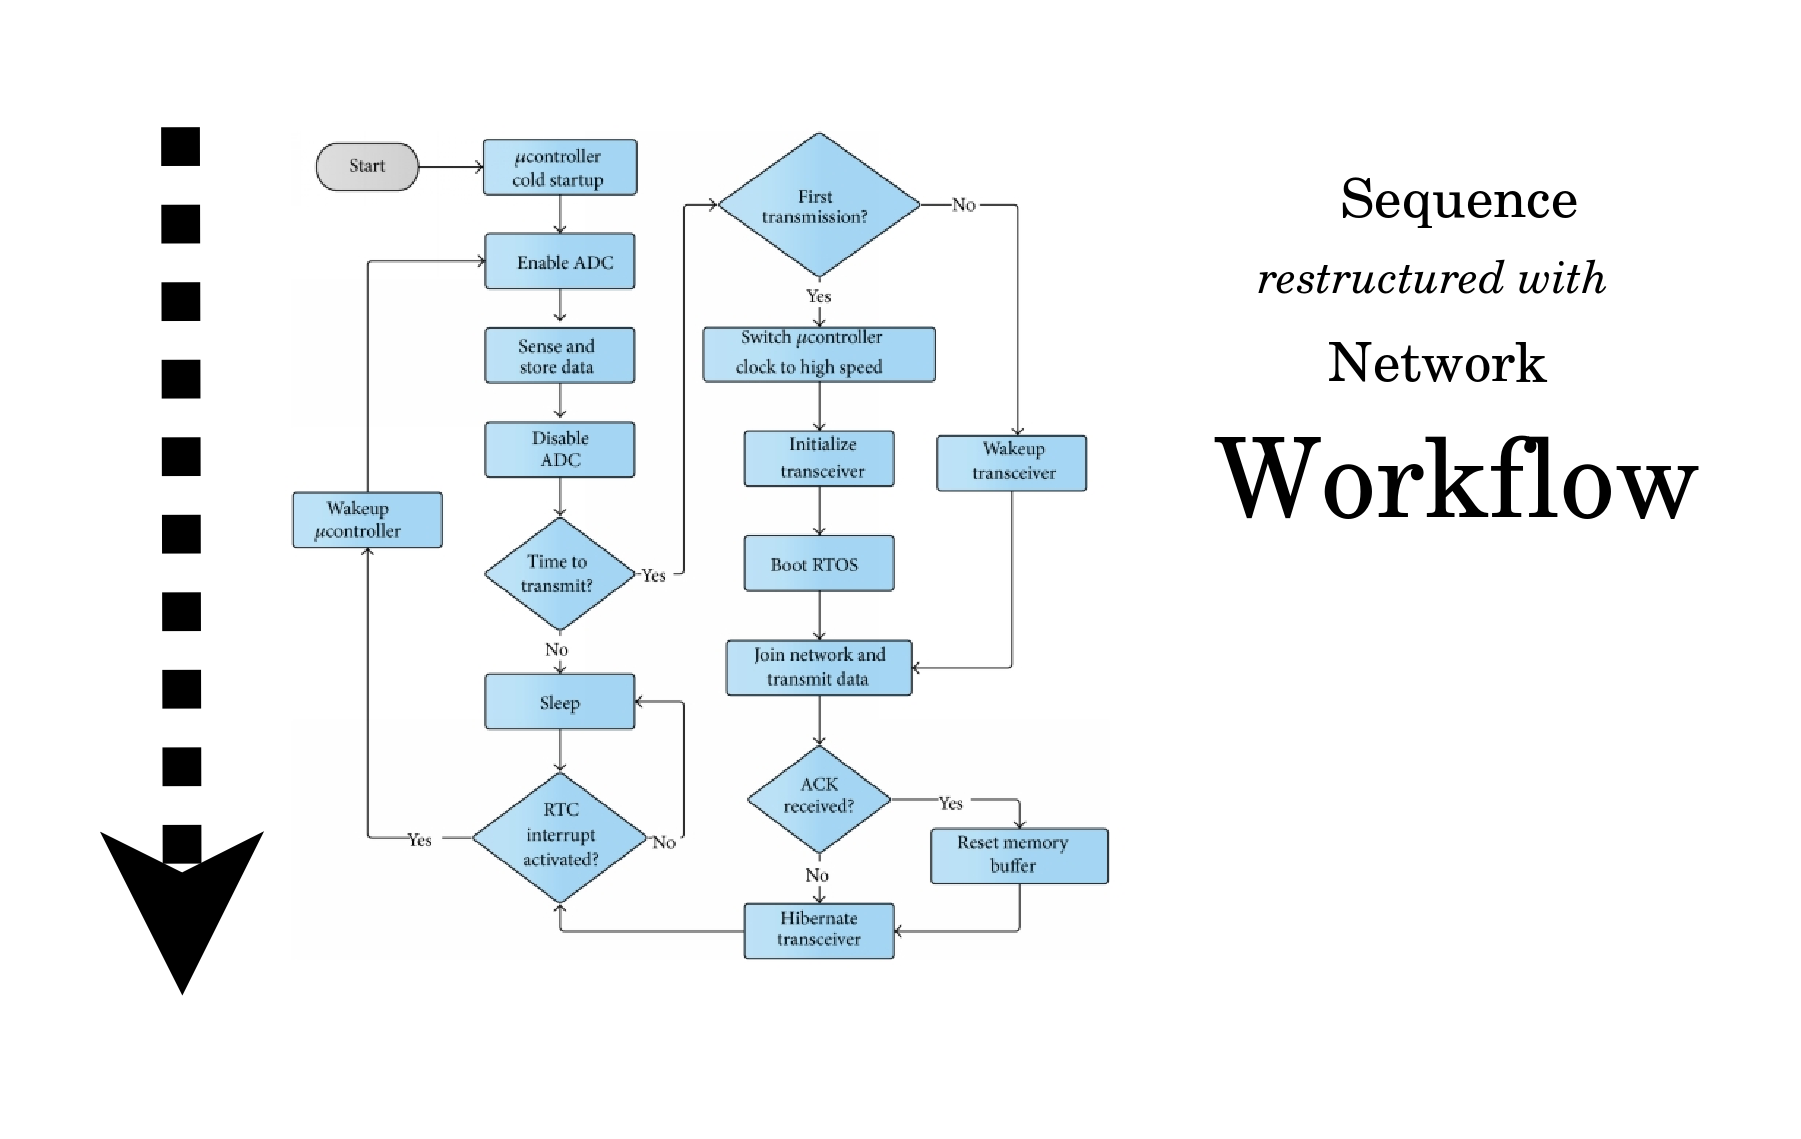
My mind recognizes a workflow whenever an underlying sequence is restructured with a network of cycles and branches. Here we can imagine interactions amongst multiple sequences in parallel. Examples include a factory line, an instruction manual, a math proof, a recipe, a book with an index or with footnotes, a holy Scripture with commentary, a genealogy or a conversation.
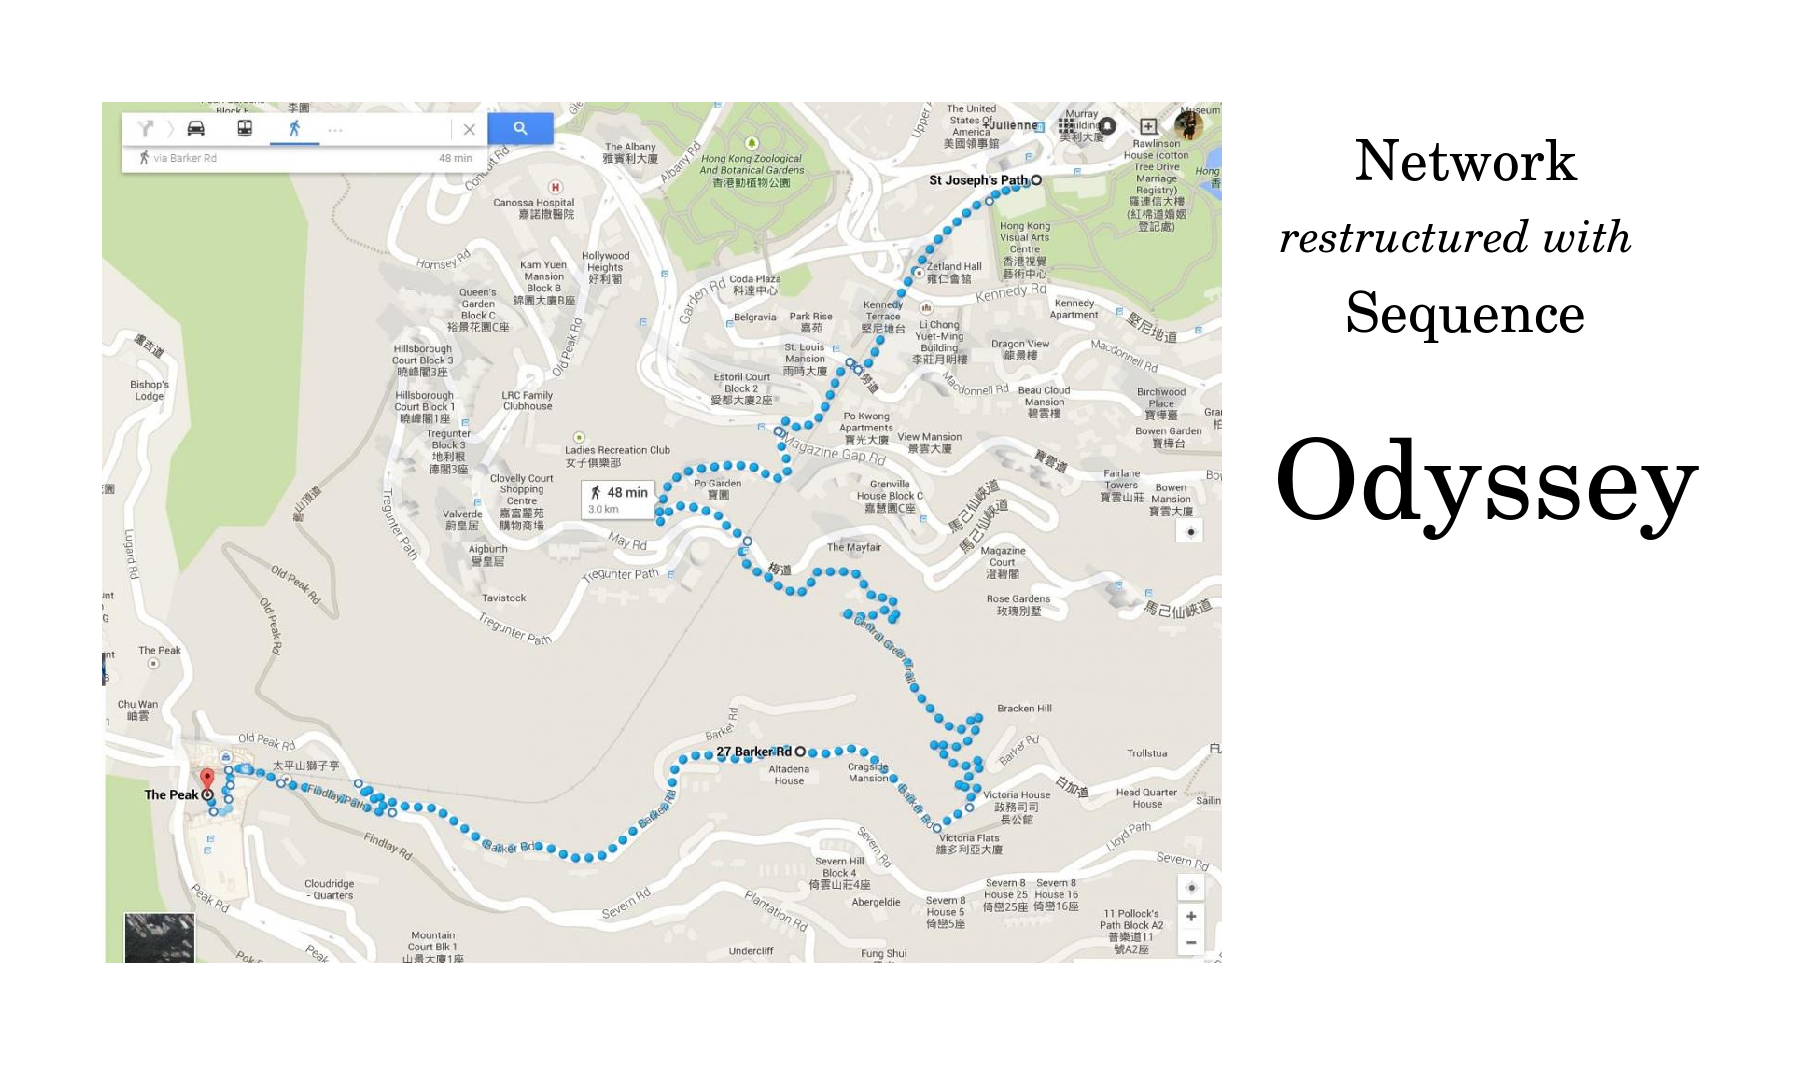
My mind recognizes an odyssey whenever an underlying network is restructured with a sequence, which may cross over itself, go in circles or change direction. Examples include a tour book, the World Wide Web, a string accepted by a finite automaton, and a Markov process.
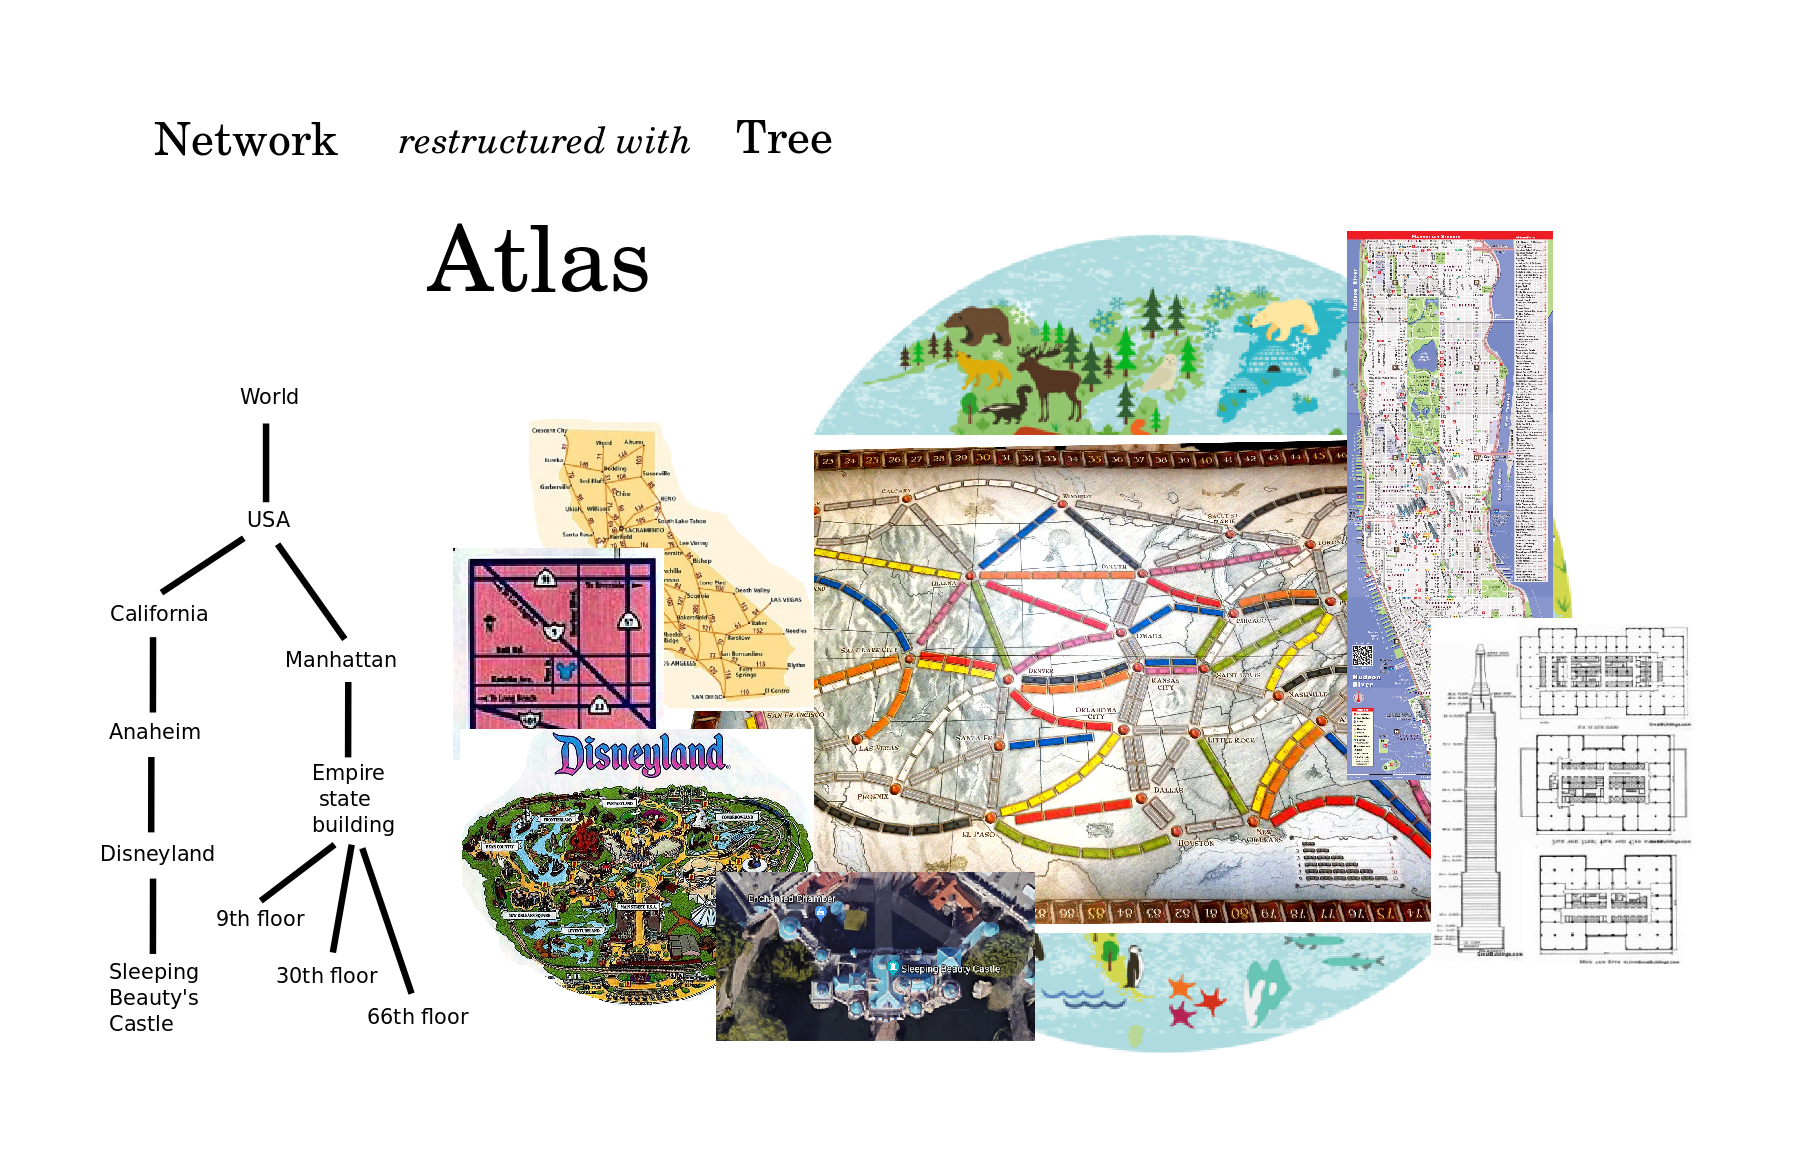
My mind recognizes an atlas whenever an underlying network is restructured with a tree of maps, which is to say, a tree of global and local views. Here the network consists of adjacency relations and so the boundaries separating two regions on the map need to be inferred as links between two regions in the mind. Examples include an anatomy textbook, a web portal, an ecosystem, and a social network.
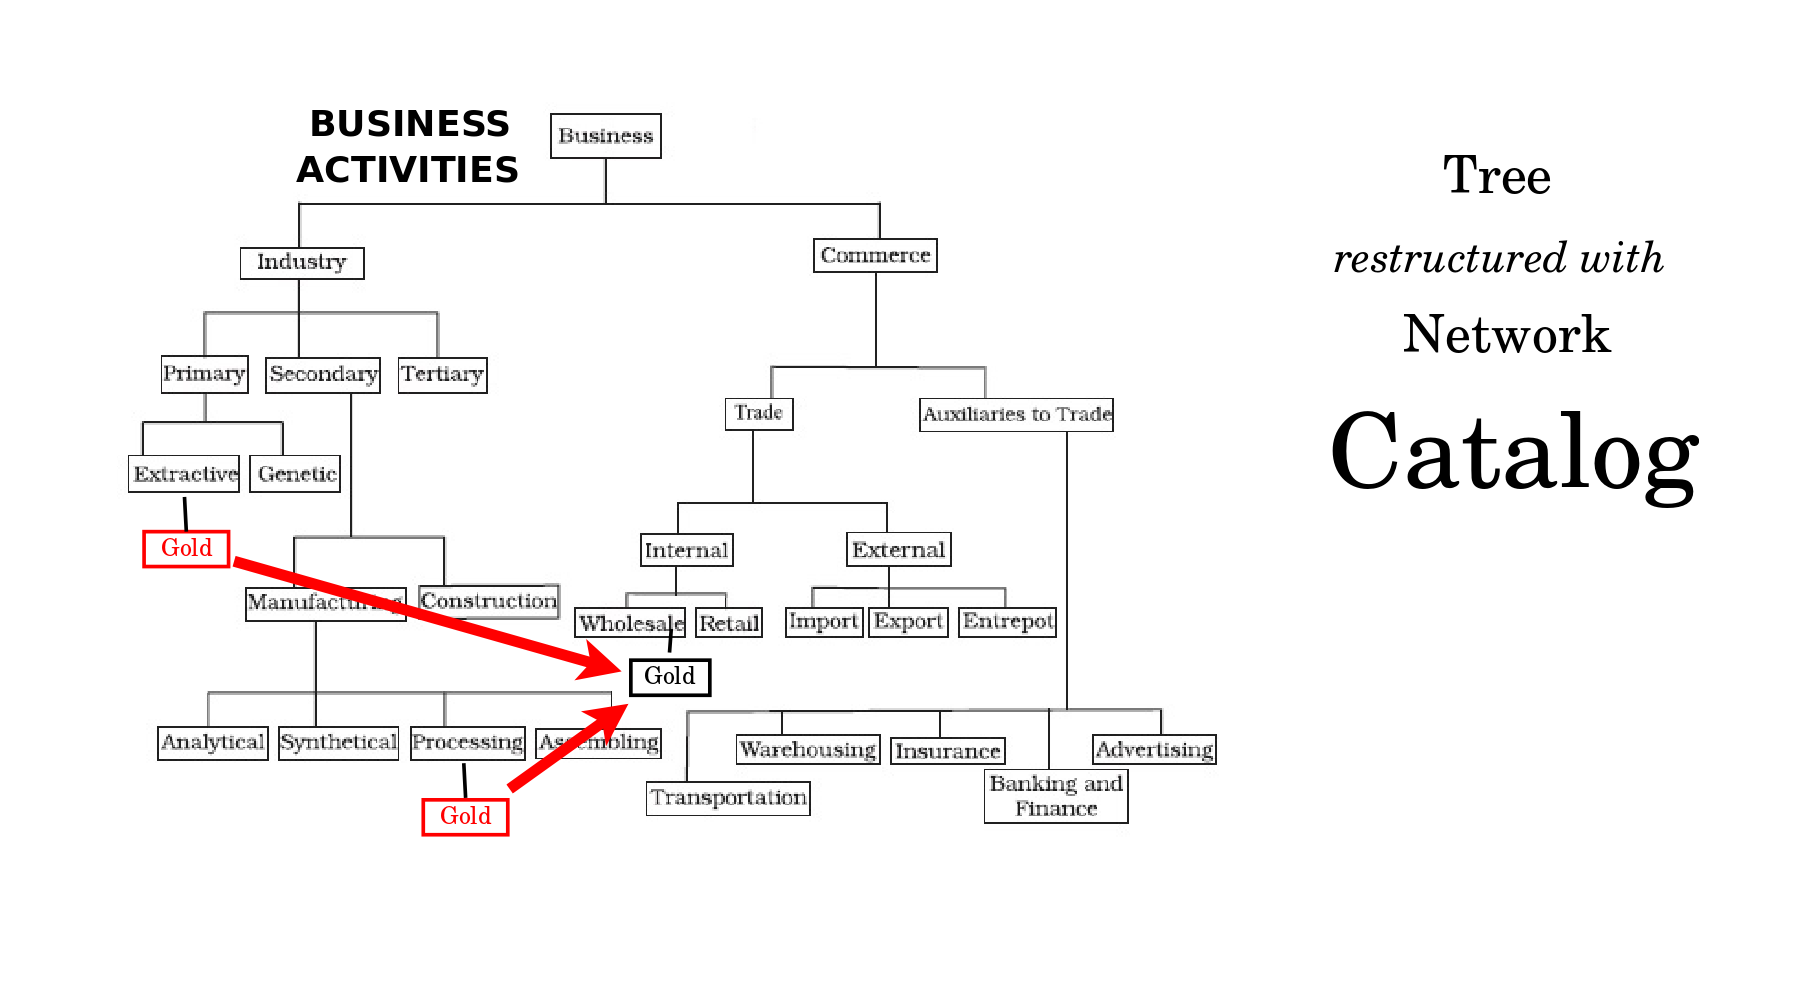
My mind recognizes a catalog whenever an underlying tree is restructured with a network of cross links. Examples include a computer's directory structure, a hardware store, a legal codex, a thesaurus, academia, infantry and bureaucracy.
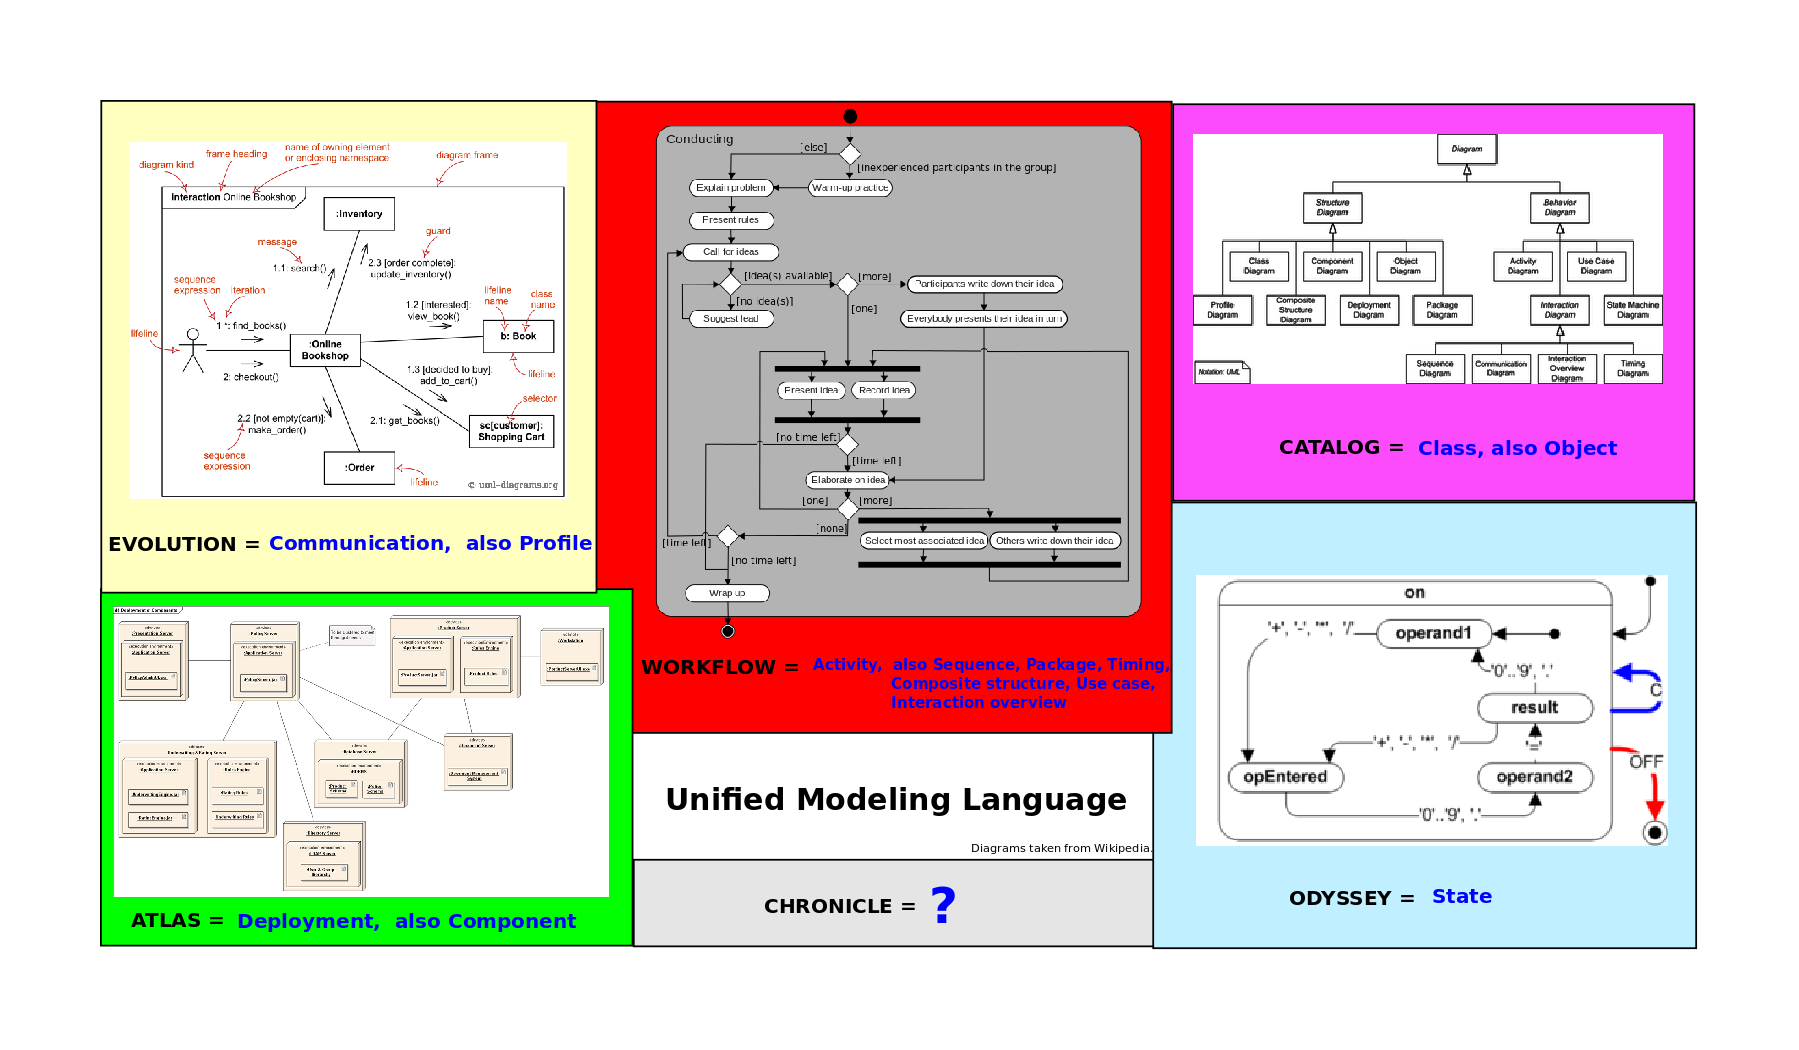
The Unified Modeling Language defines 14 kinds of diagrams by which software engineering consultants communicate when design enormous systems. These diagrams make use of 5 of the 6 visualizations. Workflows are expressed by seven of the diagrams, including Activity diagrams. Catalogs appear with the hierarchies of classes and objects and their interconnections. Atlases organize components and also show physical deployments of resources. Evolutions are manifest as propagations of information in Communication diagrams, and as domain and platform specializations in Profile diagrams. Odysseys are portrayed with State diagrams. Curiously, the Unified Modeling Language does not visualize in terms of Chronicles, although such a diagram could track the overall progress of a software project.
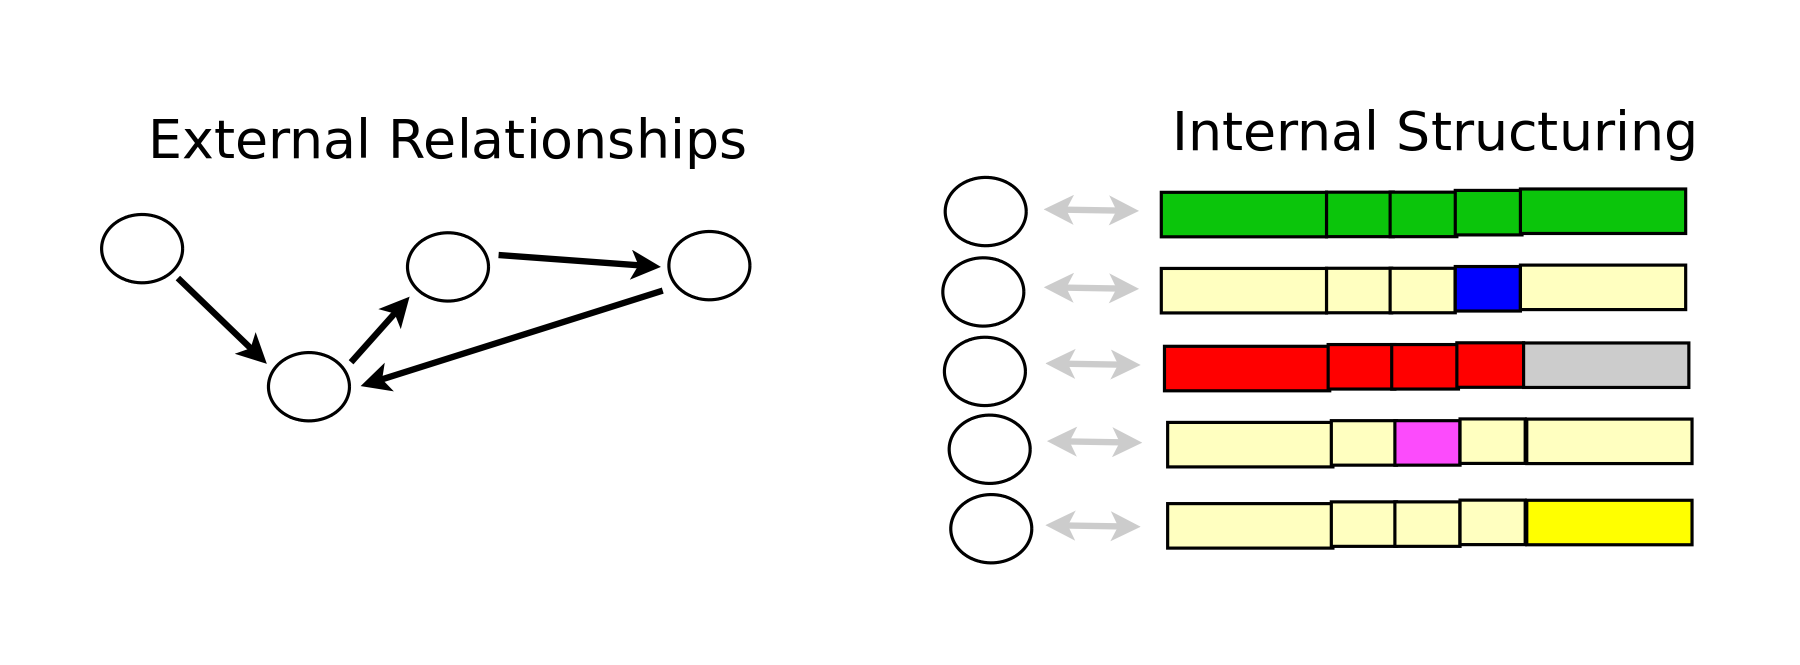
I did observe a seventh kind of organization given by any template for objects, as when we have a table of records. In this case, we may say that we simply have a collection of thoughts or objects, all of which share the same internal structure, which we may deem their type. However, the objects are otherwise unrelated to each other, and so there are no external relationships to visualize. We could visualize the internal structure using the above mentioned six visualizations, but then we would be visualizing not the objects, but their type.
I also would say there is an eighth kind of organization where the thoughts are objects are completely unrelated in that they don't even form a collection and are yet to have any type.
I think that you can replicate my investigation and confirm the following basic conclusions. Our mind can construct and work with a single, small sequence, tree or network of three or four nodes, but then does not even visualize it, as if working blindly. If it needs to picture it mentally, then it restructures it with a second such structure, yielding six possible visualizations. And it never manages to apply three structures at once, but instead switches between pairs. For example, we can think of an encyclopedia as a chronicle, reading it from cover to cover, with the articles in alphabetical sequence, organized into volumes. Or we can visualize an encyclopedia as an odyssey, a network of articles which we read by hopping from one article to related article. But we don't manage to visualize it in both ways at once.
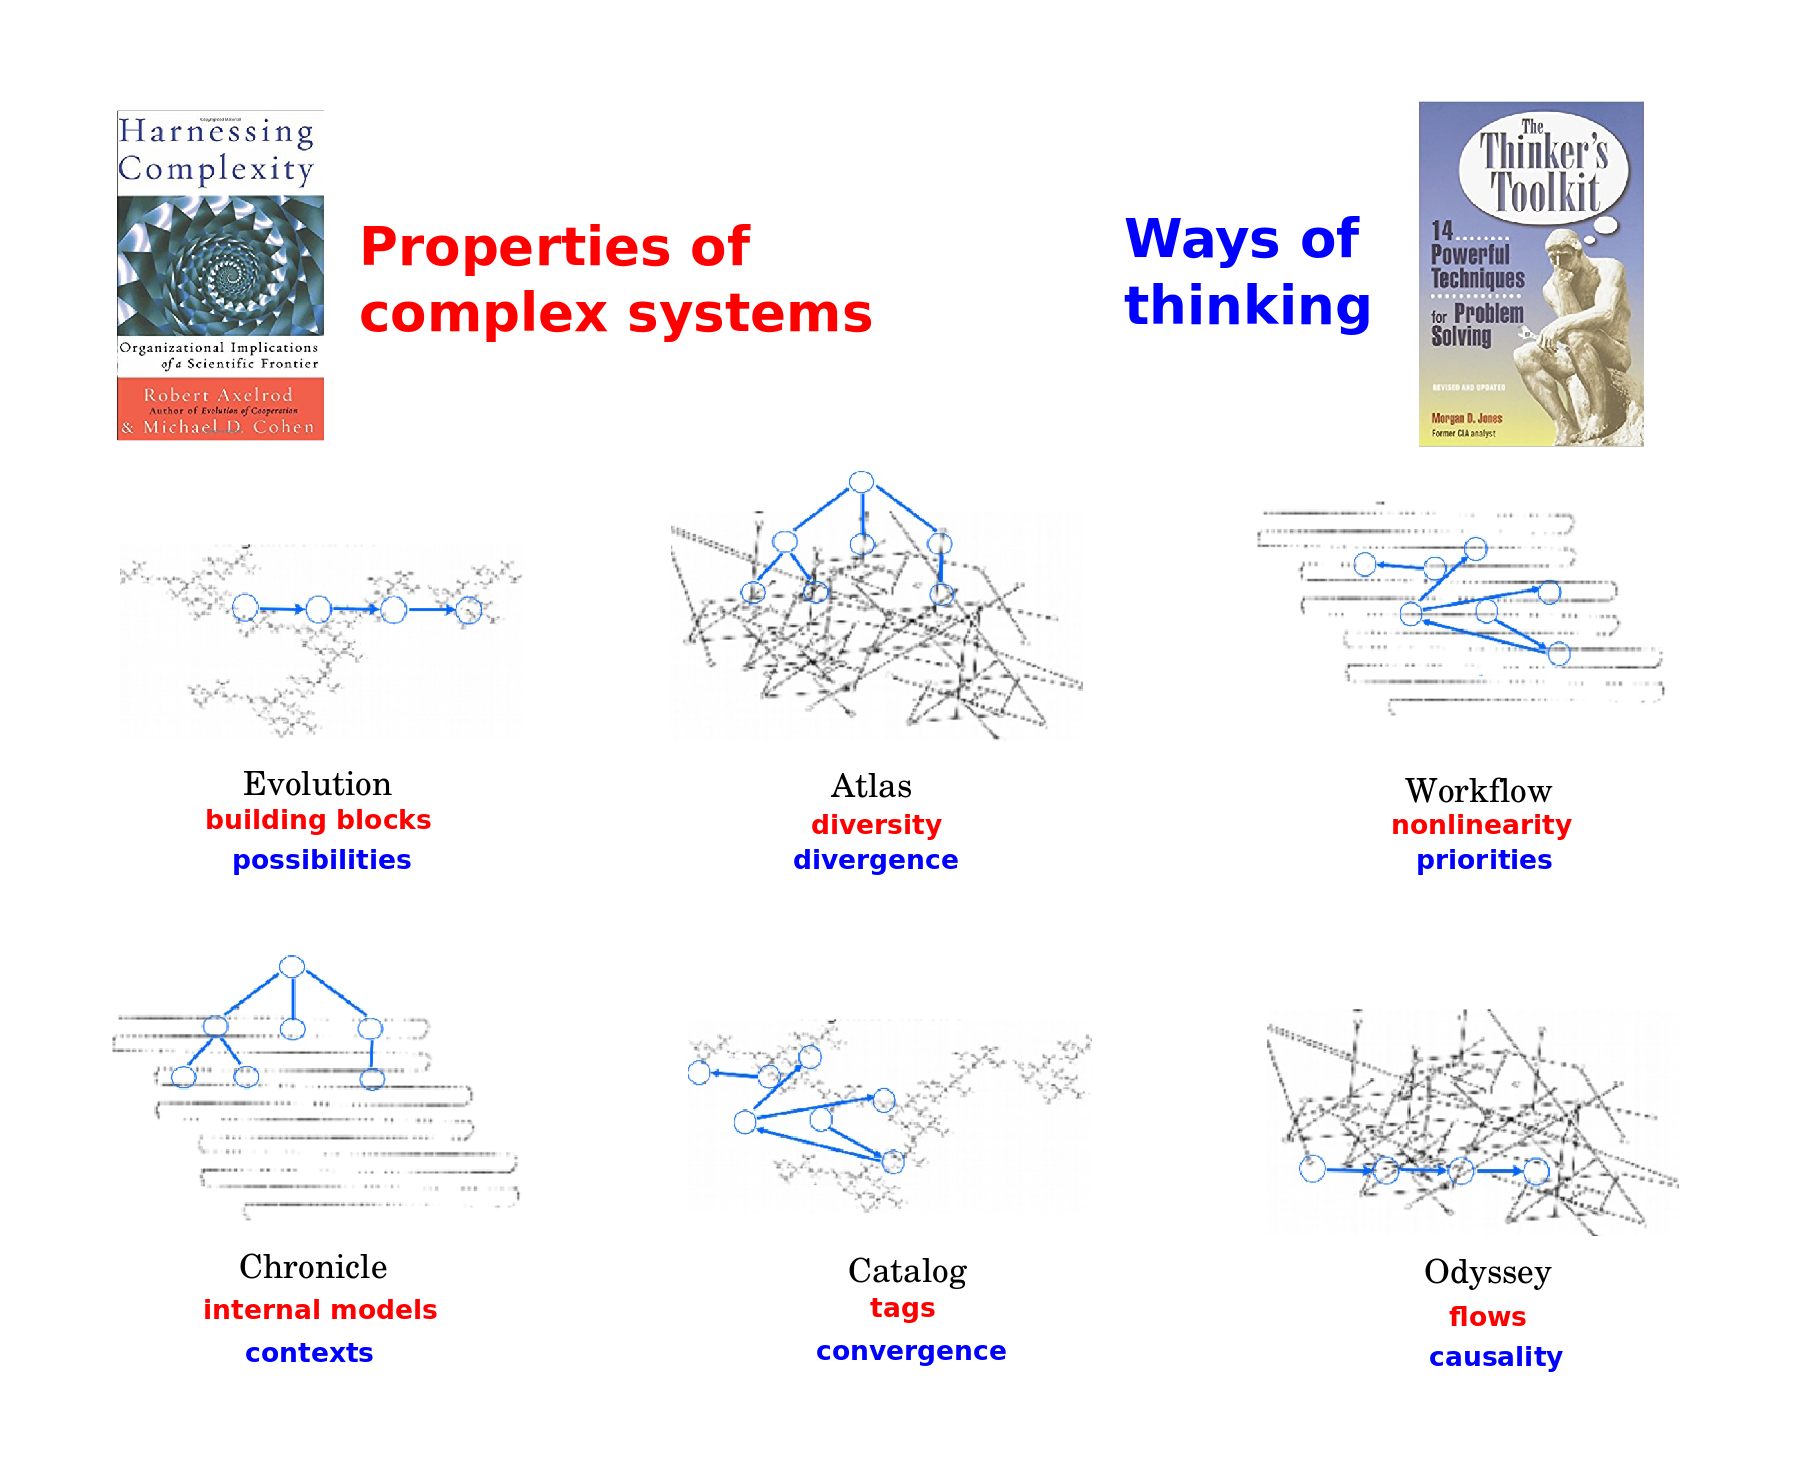
There is much to explore to understand the intuitive roles of the six visualizations. They seem to relate to the properties of complex adaptive systems discussed by Robert Axelrod, and also the tools for thinking described by Morgan D.Jones. We can see that the visualizations come in pairs, and also that they can point to the big picture or lead us out into the details.
An evolution lets us consider different possibilties, yield different building blocks. A chronicle assembles them into an internal model, and identifies the relevant context.
An atlas establishes a diversity of stable niches, and thus fosters diversity and divergence. A catalog equates items with tags, and thus encourages convergence.
A workflow structures greater and lesser priorities. Its branches and cycles ground nonlinear response. An odyssey lets us analyze flows as to whether they are virtuous or vicious or whether they vacillate, and thus lets us study effects and their causes.
The visualizations thus give our minds a framework for duality in thinking.
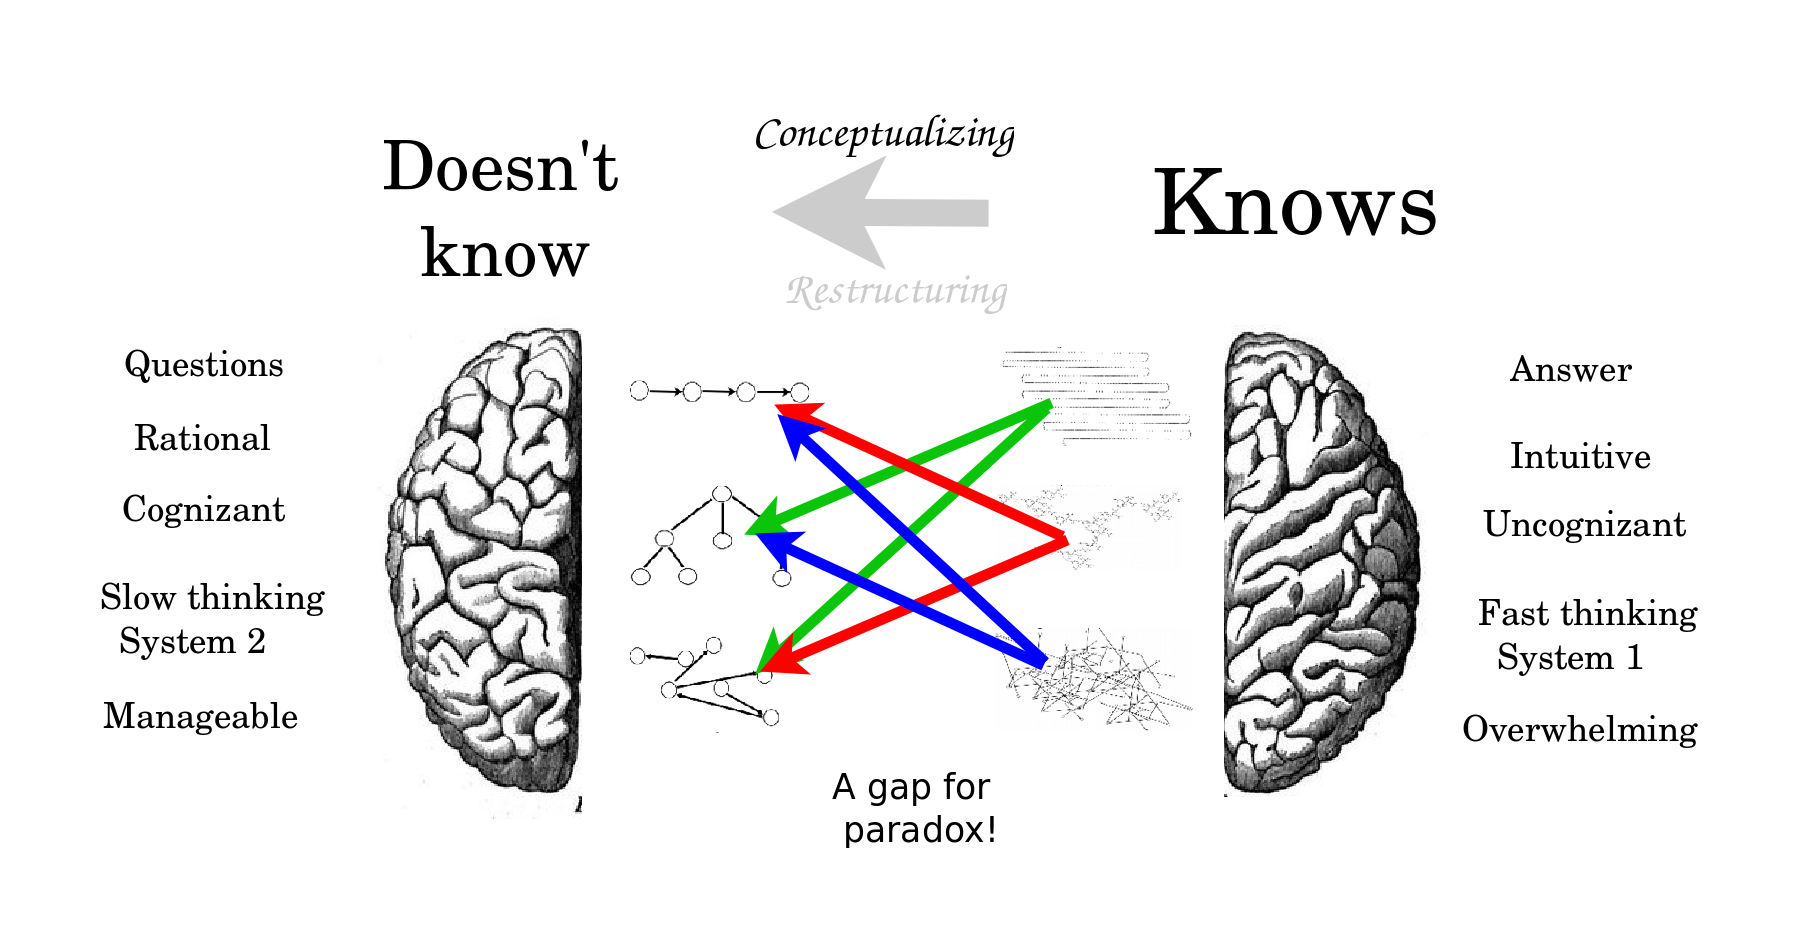
The duality is made possible by the crucial gap between the underlying, enormous, primary structure and the manageable, mindful, secondary structure. I consider the primary structure to be the sum of the data that we sense intuitively which we visualize by reorganizing it with a secondary structure of vantage points.
I identify these two structures with the spontaneous System 1 and deliberate System 2 studied by Kahneman and Tversky, and likewise, with the right and left hemispheres of the brain, considered as advocates for the intuitive answers by which we know and the deliberate questions by which we don't know. The six visualizations suggest that we visualize our thoughts when we reconceptualize the semantics of what we know in terms of the syntax of the questions that we can investigate. I believe the purpose of logic is then to perfectly balance what we know and what we don't know so as to entertain the vital gap between them, as the source of ambiguity, choice, freedom, but also as the basis for absolute truth.
I will now point out the role of that gap in all manner of paradox. In 2012, I went through Wikipedia's list of paradoxes in an attempt to develop a taxonomy of paradox. I realized that similar paradoxes shared the same visualization and I could group them accordingly. In each case, the paradox is simply an illusion that arises from our mind taking the visualization literally, and thus glossing over the gap between the primary structure and the secondary structure. This yields six paradoxes based on the six visualizations, as follows.
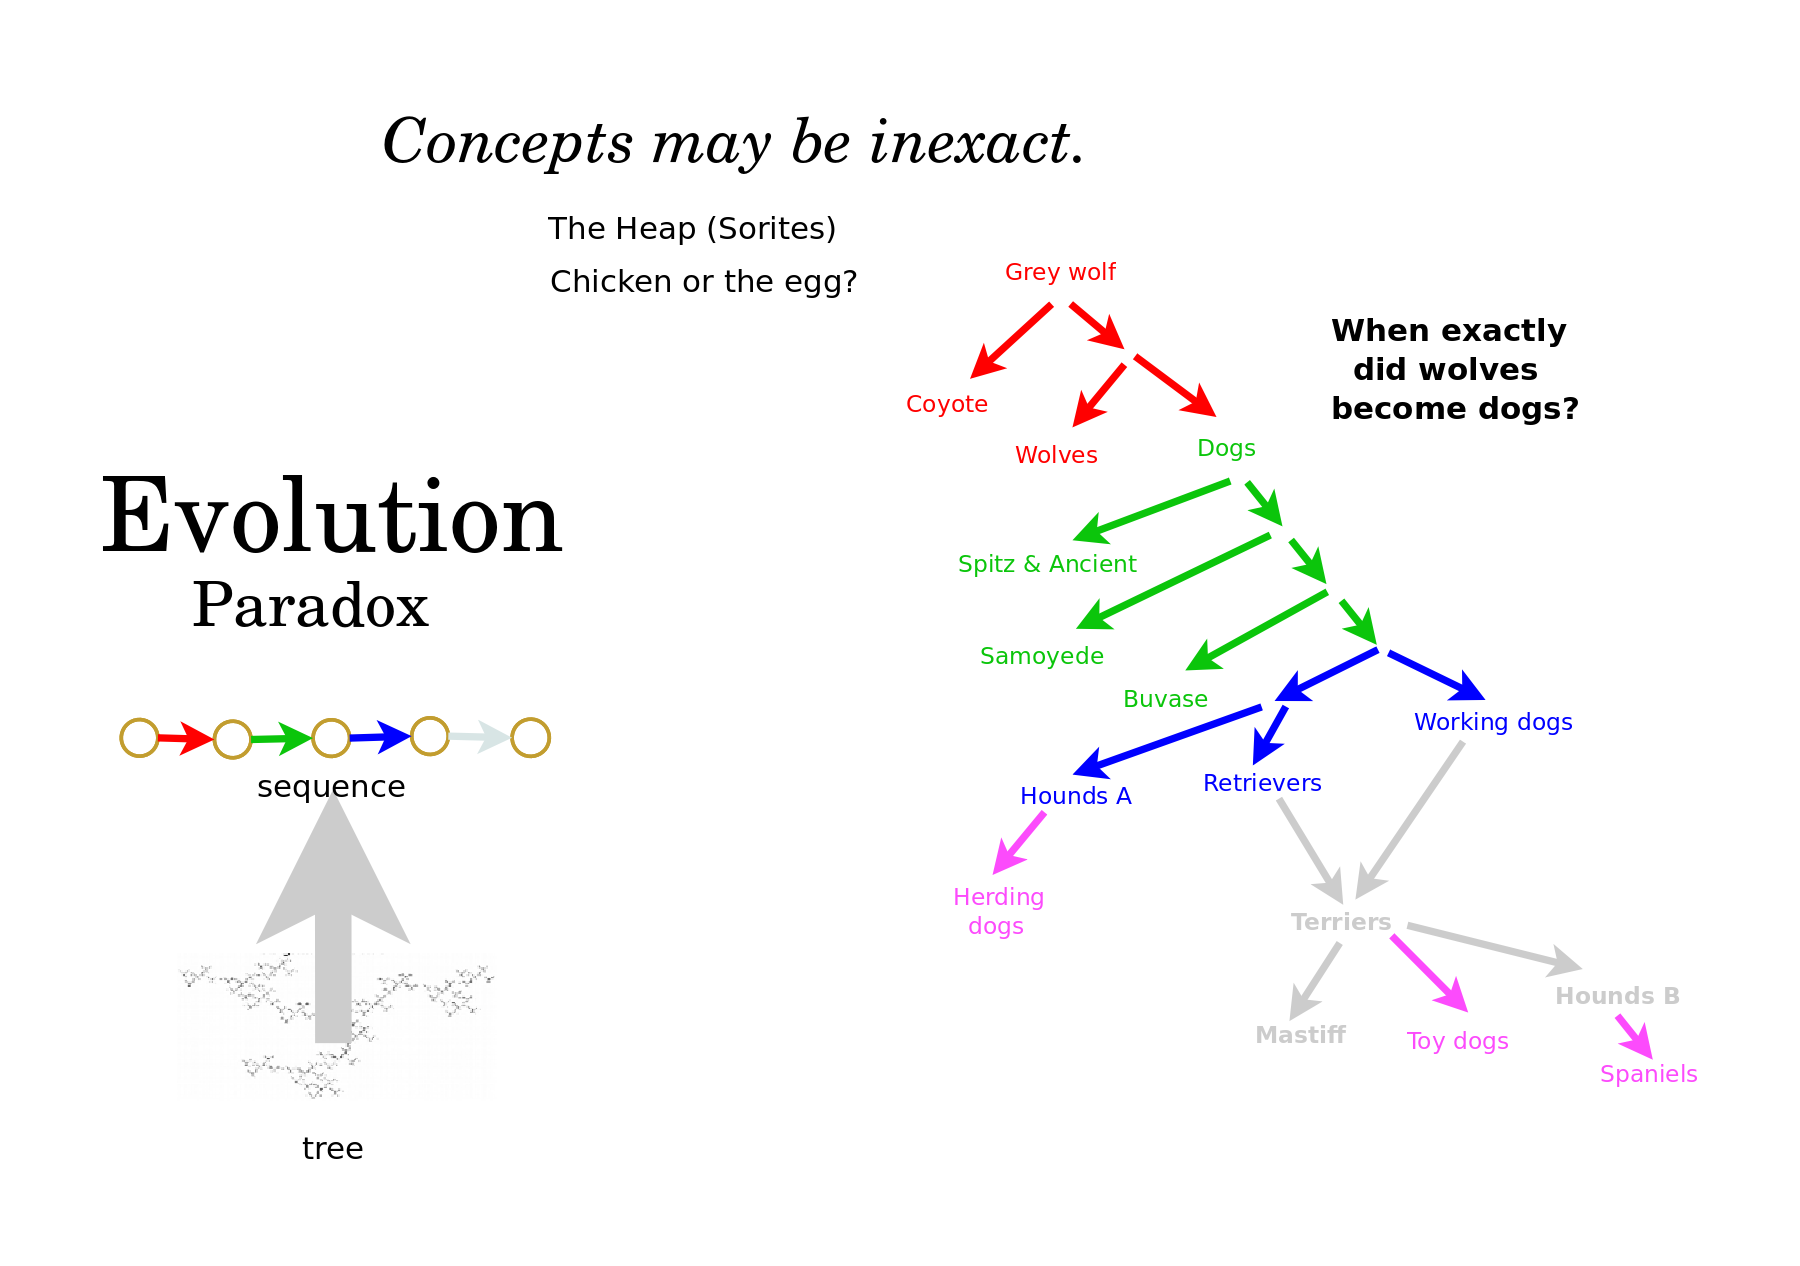
The Evolution Paradox is that concepts may be inexact. There are simply too many branches in the tree of varieties and too few steps in the timeline to distinguish them. Thus we may not be able to specify at what point dogs diverged from wolves, or at what point in the womb a child became conscious. In the paradox of the heap, we may be inclined to believe that a heap is just a number, which could be counted sequentially, but actually, a heap is a jumble, for which a precise definition would depend on many subtle factors, a tree of possibilities.
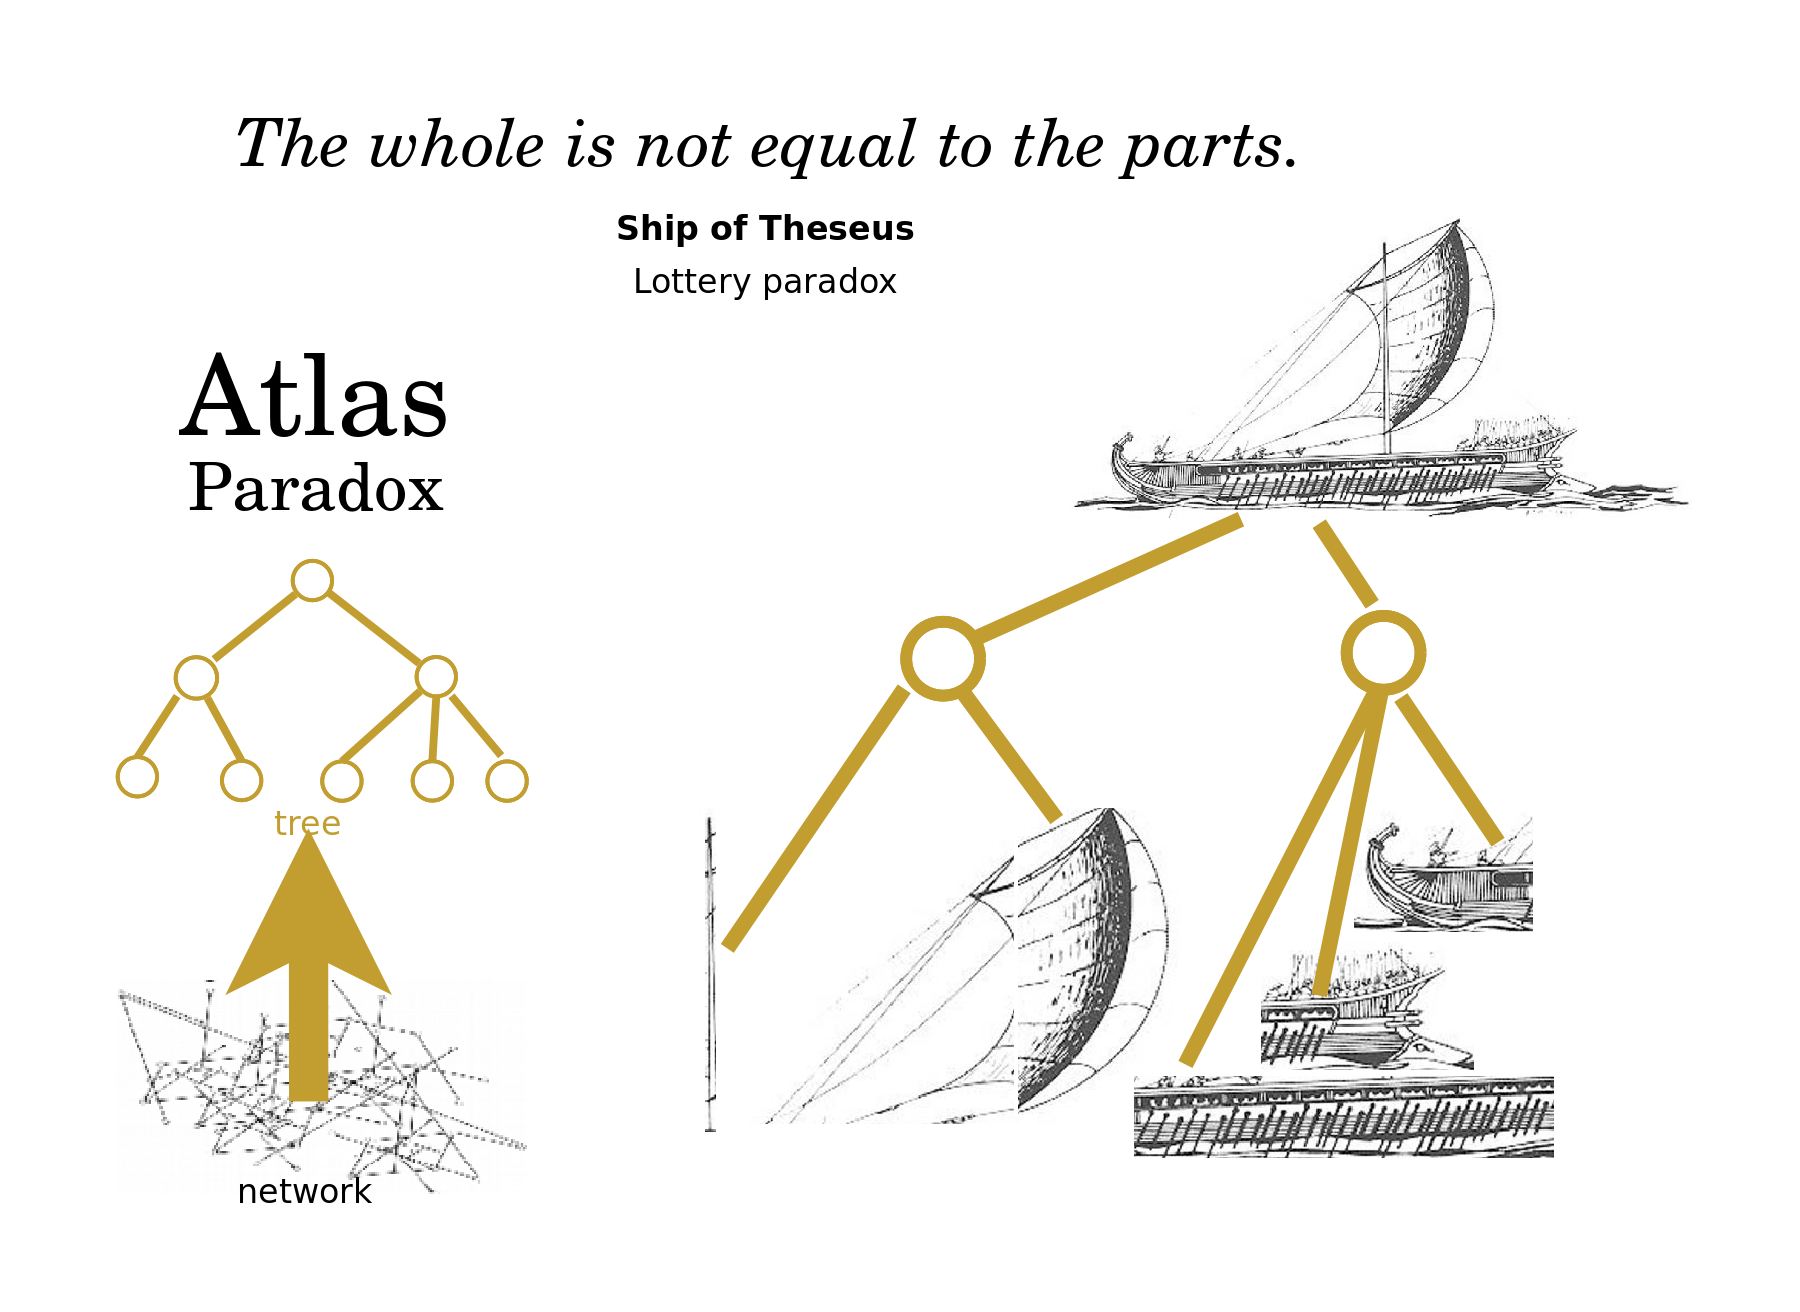
The Atlas Paradox is that the whole is not equal to the parts. An example is the famous paradox, the ship of Theseus. If we replace all of the parts of a boat, and then build a copy with all of the old parts, which is the original? The problem is that we are conflating the network of parts with the tree of global and local views. We can argue that the identity of the boat is given by our conceptualization of it, in which case it is given by the tree. In that case, the identity is preserved by the old boat, if it maintains the relation between its major components, say the mast and deck and hull and such, because the whole is established by that relationship, which is maintained. But in any event, the paradox arises from not distinguishing the network and the tree, which is to say, the boat's materials and the boat's conceptualization.
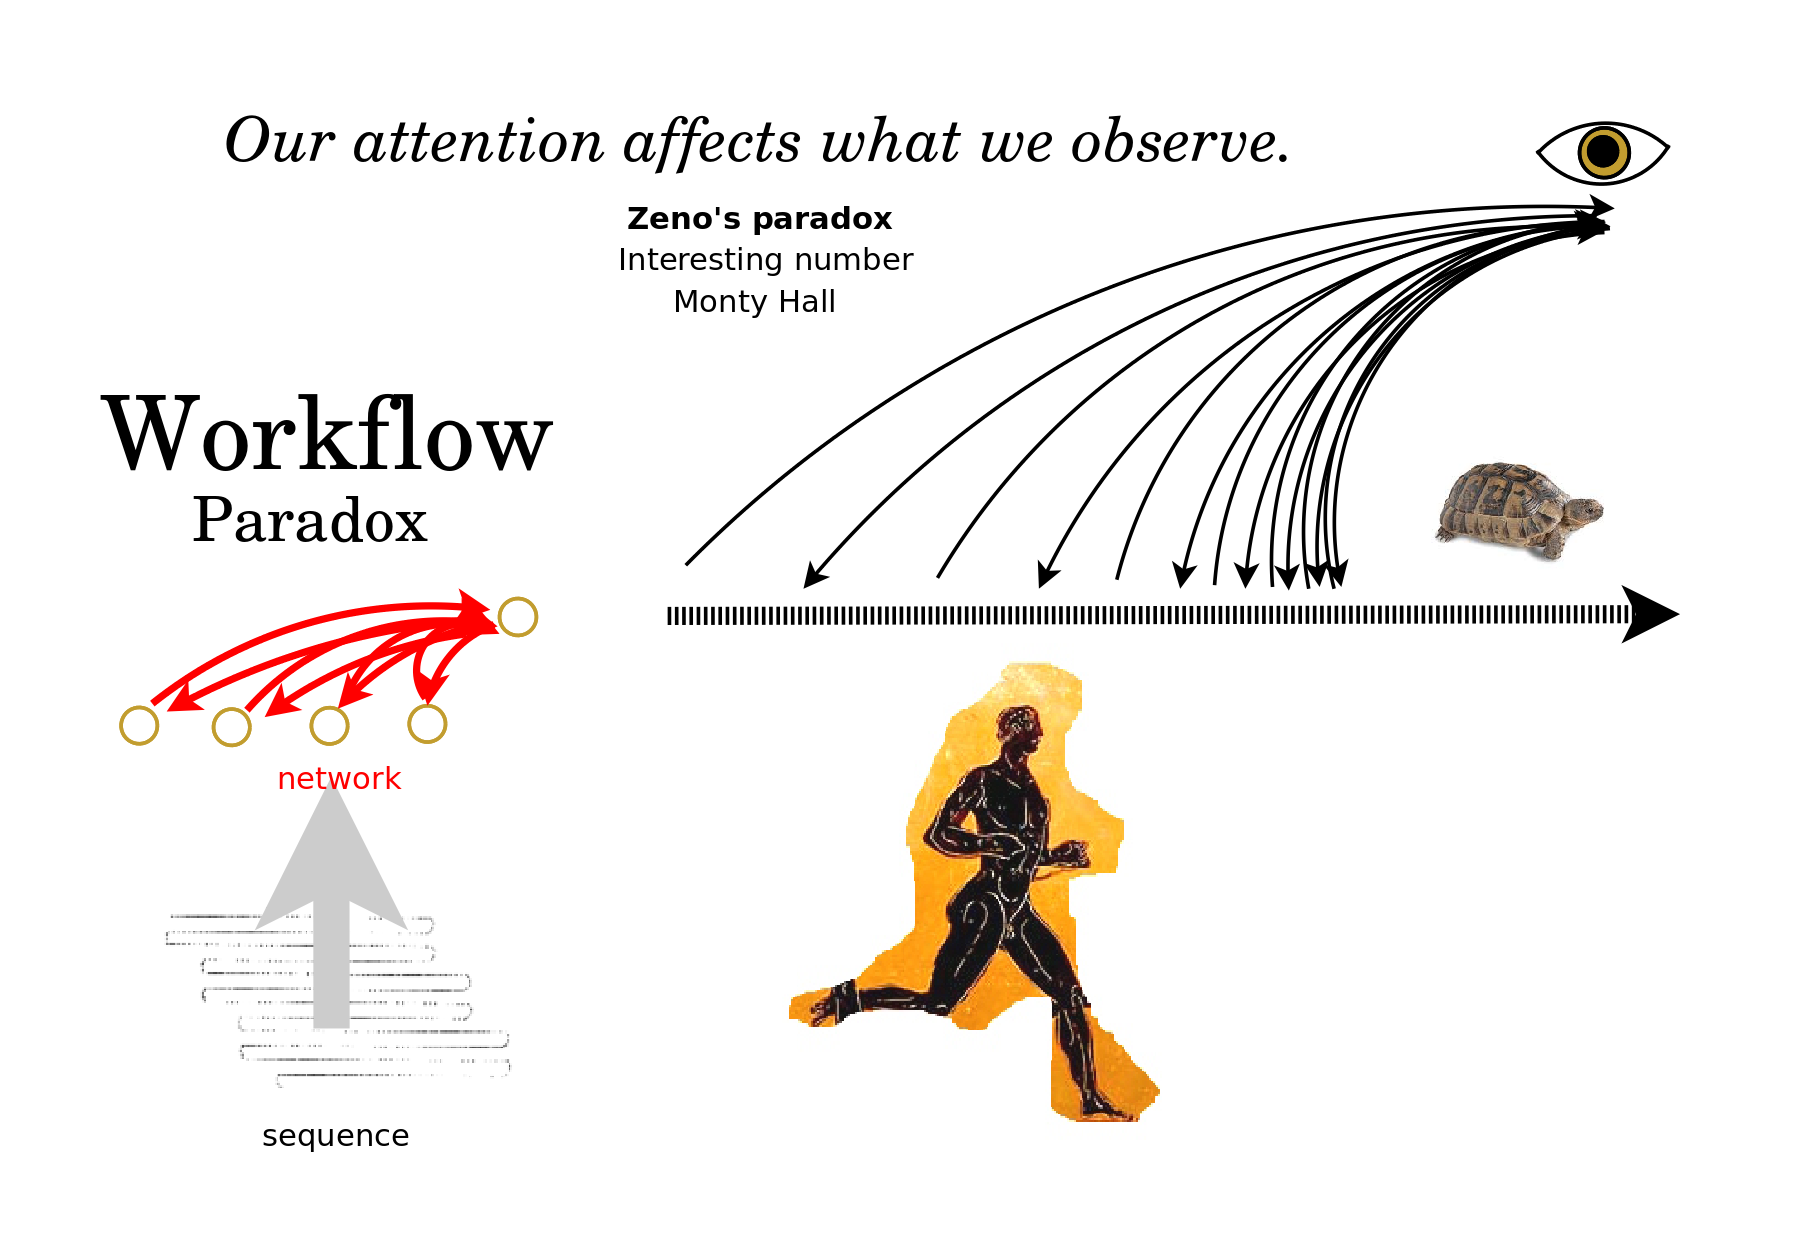
The Workflow Paradox is that our attention affects what we observe. Achilles can never catch a turtle if we keep measuring the distance between them. Increasing a tax rate may decrease the revenues received. A law may be more clear when it is kept less precise. The spirit of the law is not the letter of the law!
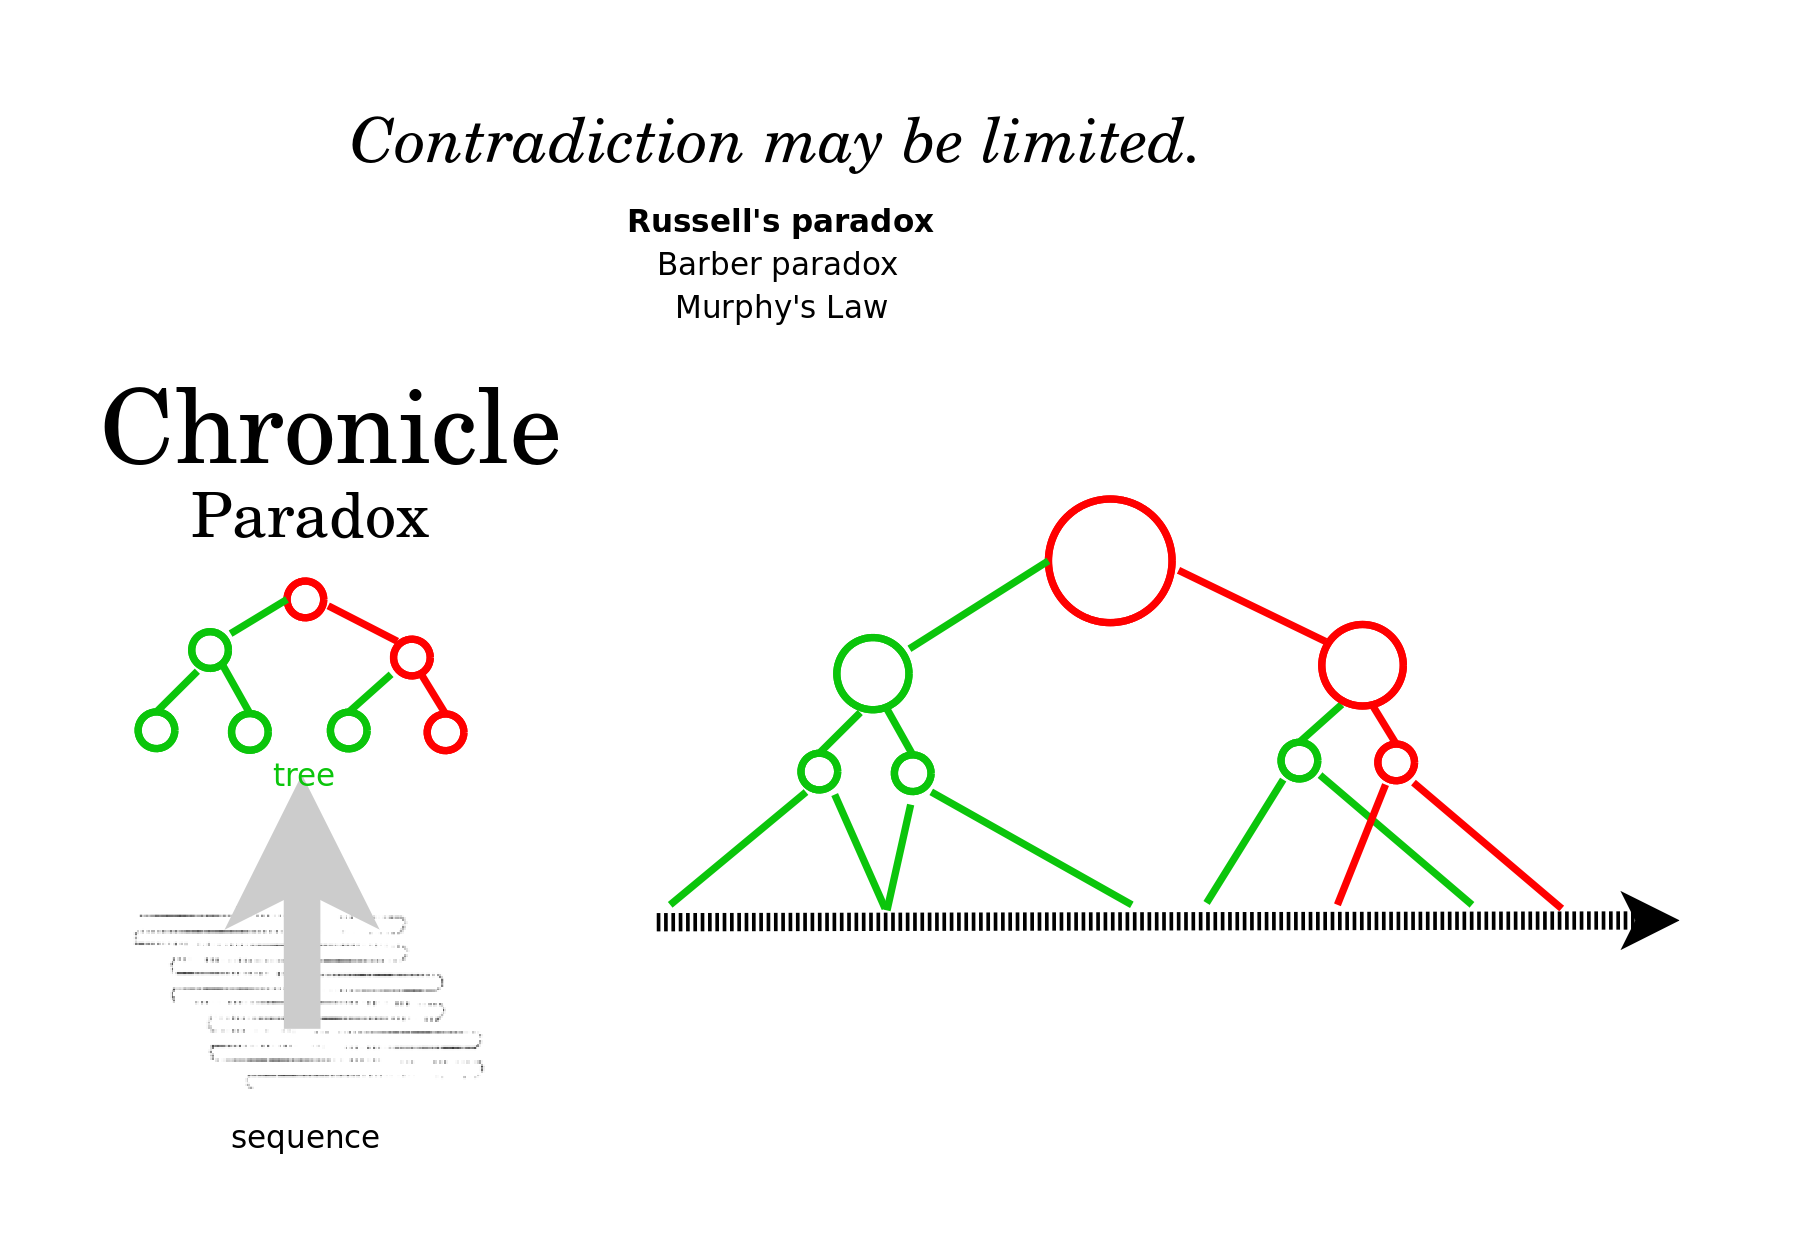
The Chronicle Paradox is that there may be a limited contradiction. How can we accept a witness in some matters if she is not trustworthy in other matters? And yet we must if we are to learn from her bad experiences or from our own.
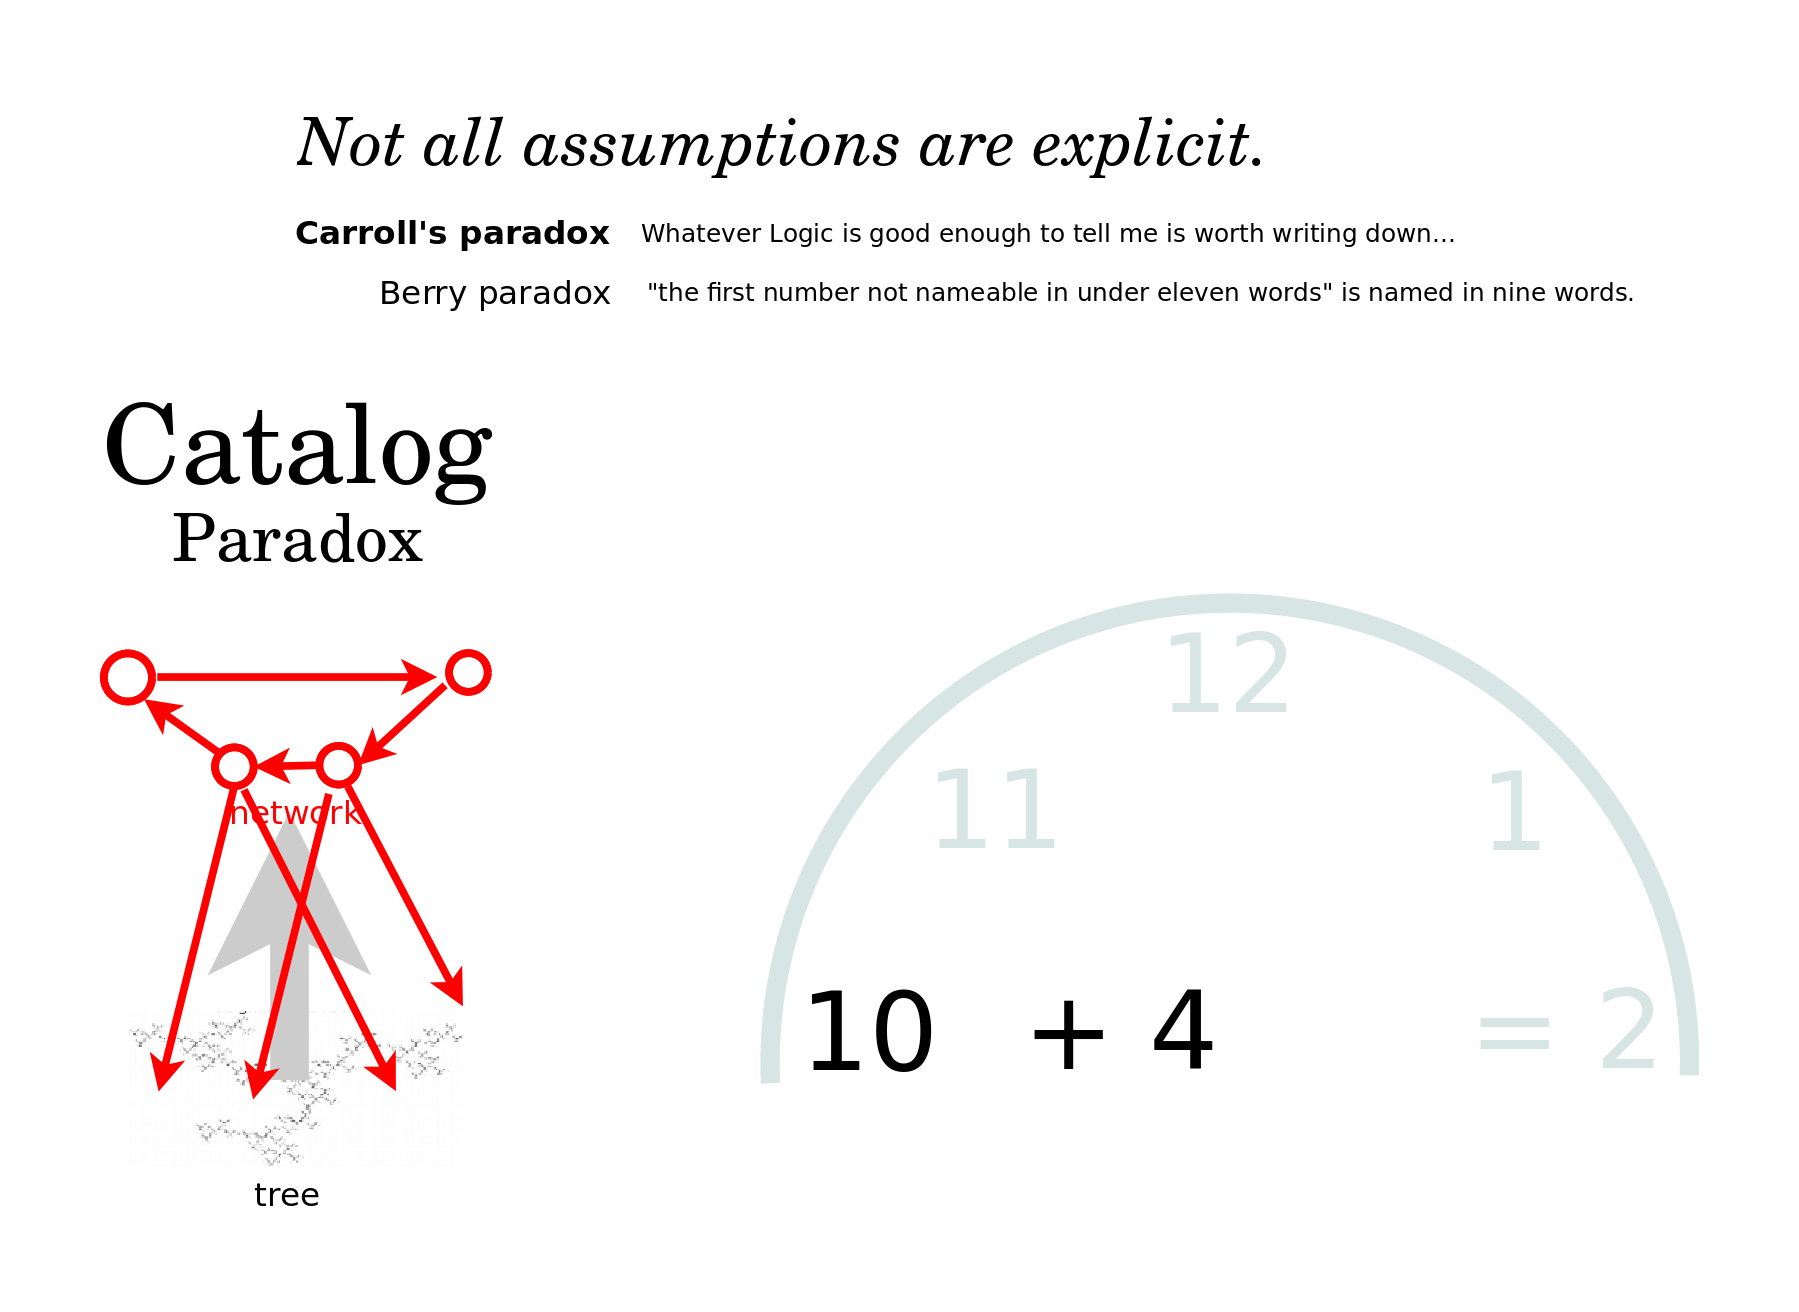
The Catalog Paradox is that we cannot make explicit all relevant assumptions. The school teacher may ask, what is 10 + 4? And the answer will be 2, if she has in mind a clock with 12 hours. How can we be sure what she has in mind, or what language we are speaking, or what is the meaning of a blank page?
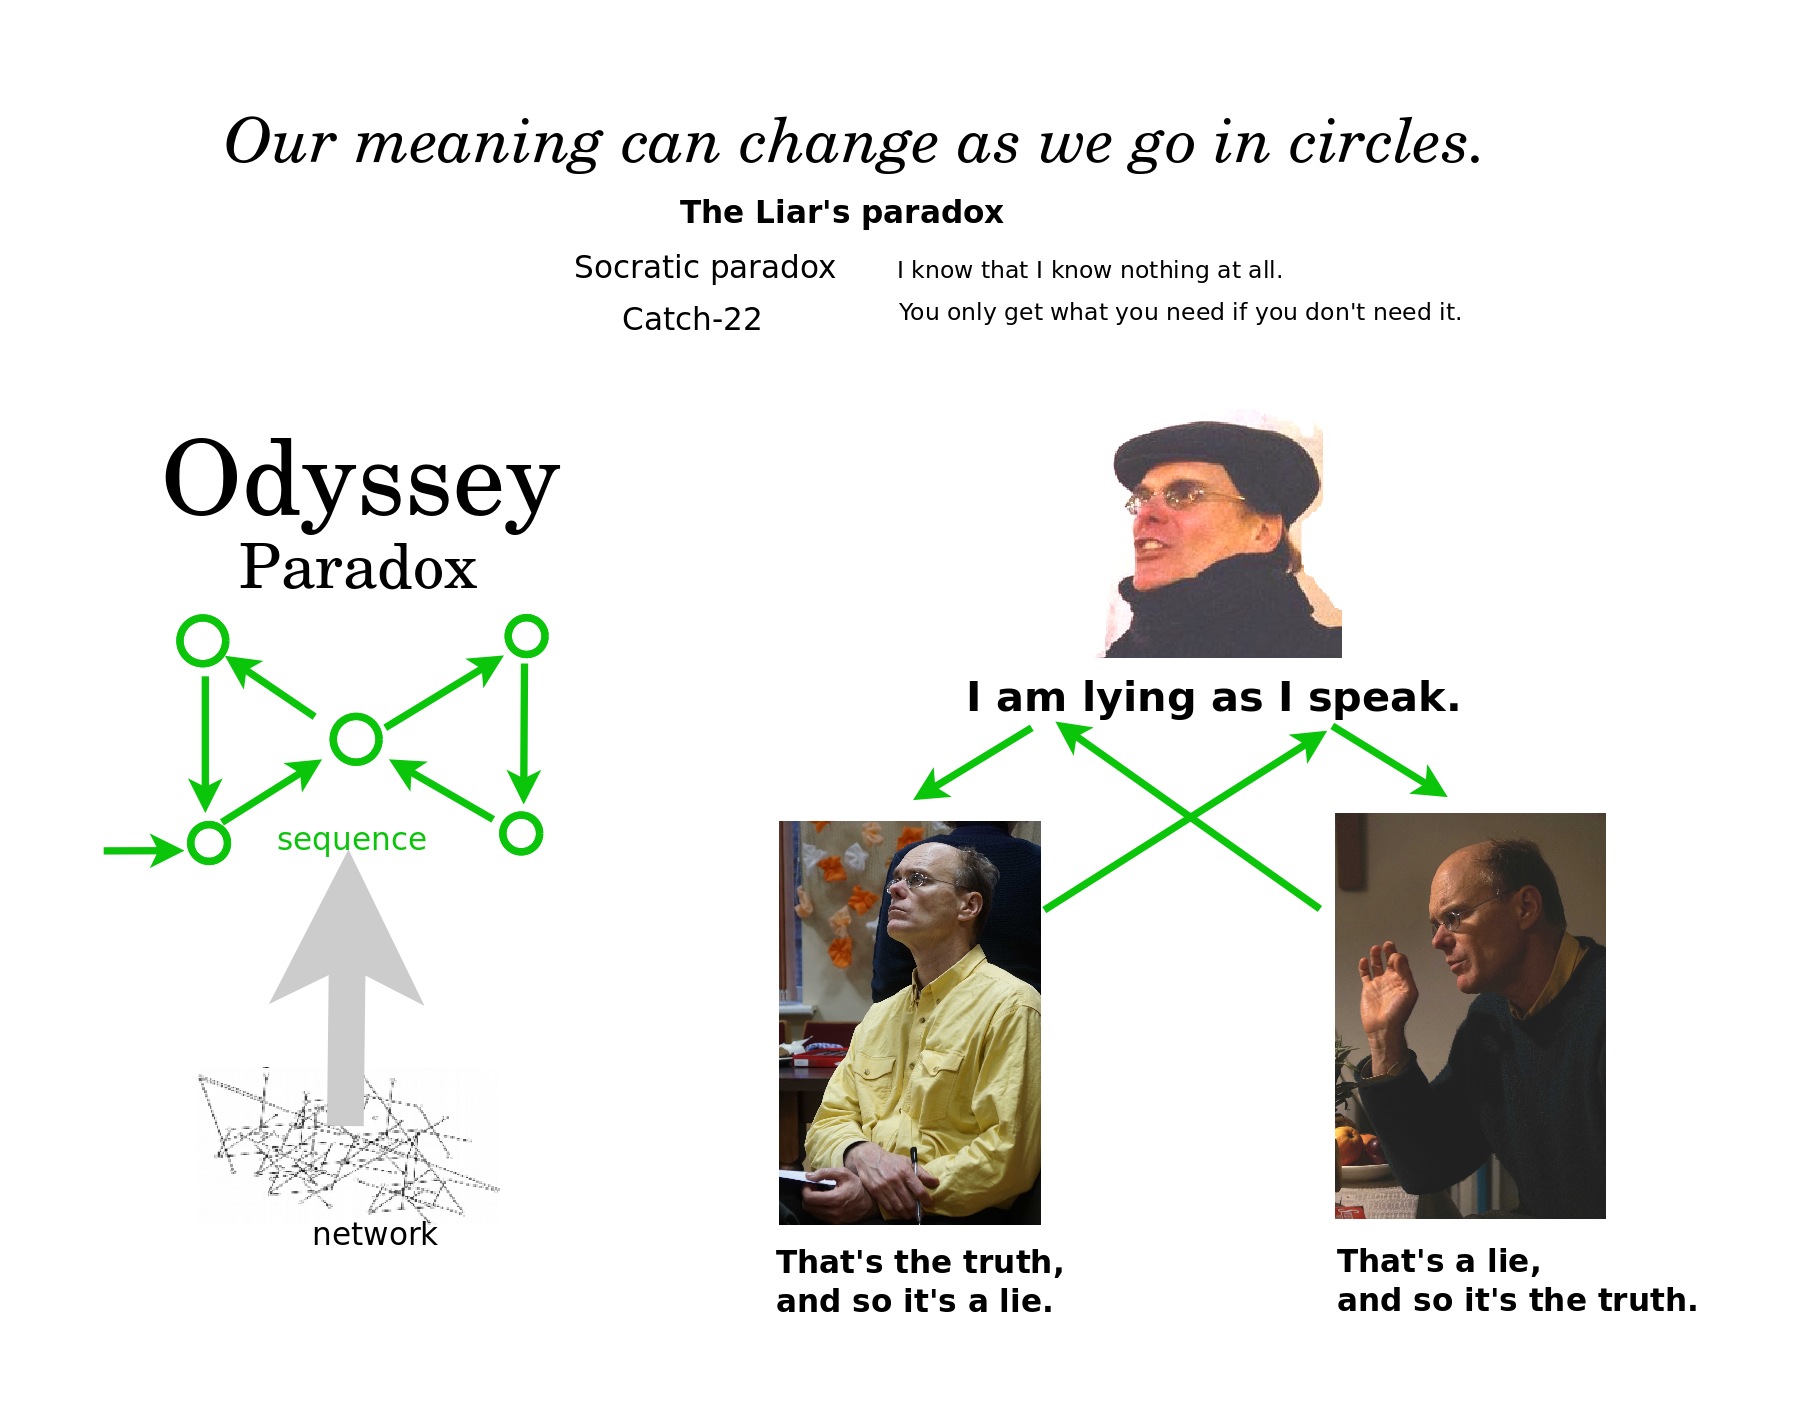
The Odyssey Paradox is that our meaning can change as we go in circles. We can contradict ourselves: "I am lying as I speak." Our meaning at the middle of the sequence can depend on where we started and where we end. This yields ambiguity and thus a freedom to choose. We can go round in circles, come back to the same spot and choose a different direction.
I need to do a more thorough and comprehensive analysis of paradox. However, based on these examples, I feel that the visualizations are not just a source of paradox, but in fact, being visualizations, they are the source of all mental illusions, and thus THE source of all paradox.
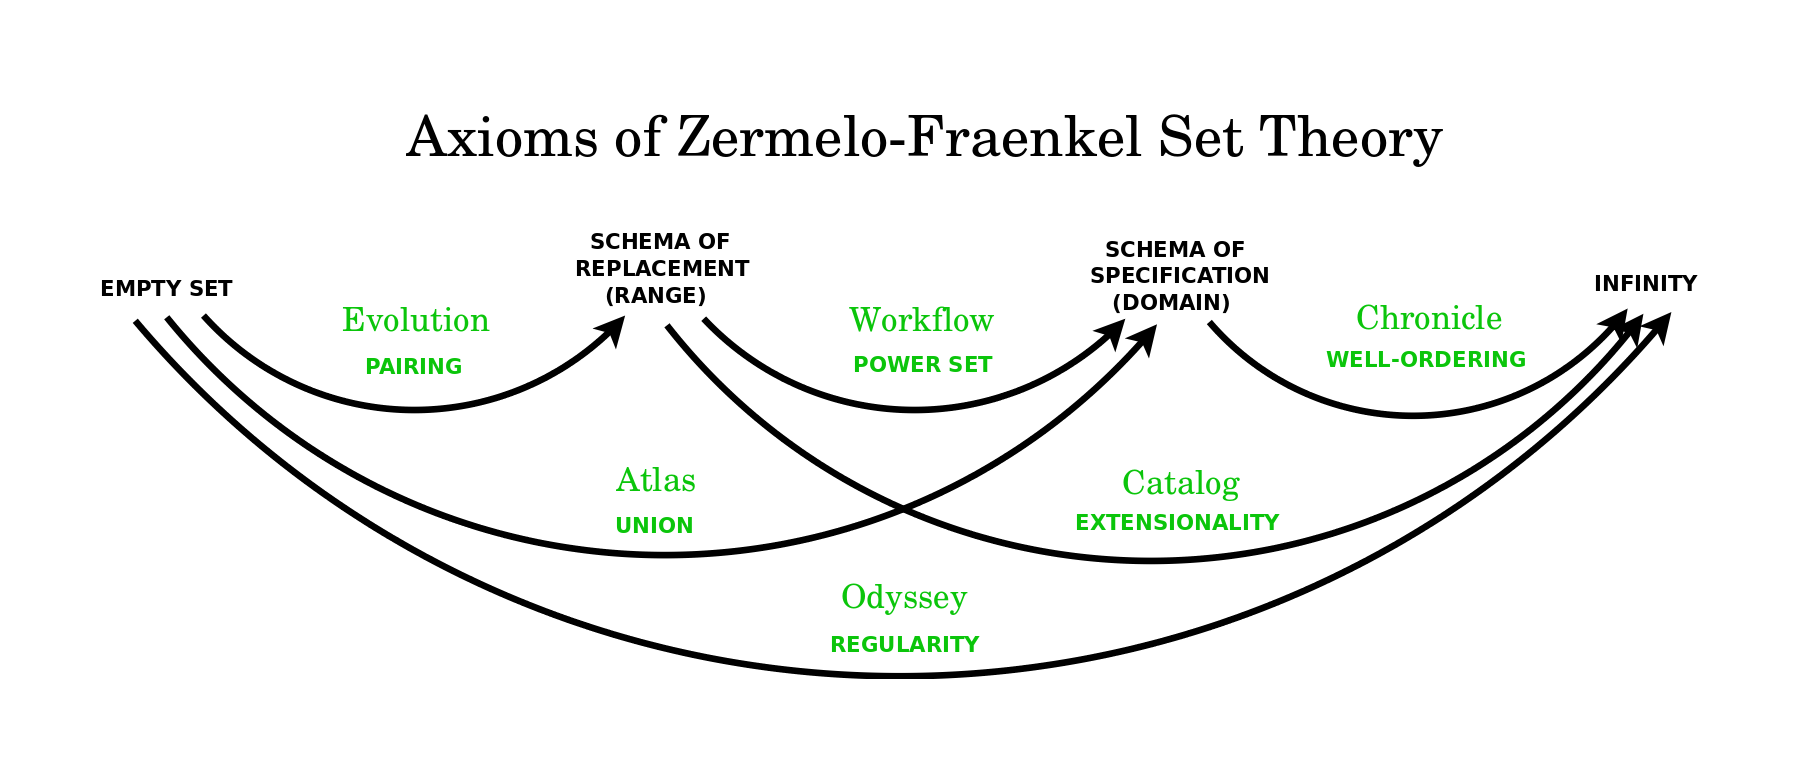
Finally, I will conclude by noting that these same six visualizations can be taken as the cognitive basis for six axioms of set theory. Evolution lets us generate all manner of sets from the Pairing axiom. Atlas lets us consider a union of maps, and likewise, a union of sets. Workflow lets us distinguish conditions and subconditions, and likewise, lets us imagine the Set of all subsets, which is to say, the Powerset. Chronicle lets us suppose that every period in a tree can be associated with some characteristic instance, which is to say, it supports Well Ordering, or simply, the Axiom of Choice. Catalog lets us use crosslinks to associate the same items with different names, thus grounding the equivalence of sets which have the same elements, in other words, Extensionality. Odyssey allows us to inspect whether there are any cycles, which is the point of Regularity.
We might say these are the syntactic axioms of Zermelo Fraenkel set theory. If we add an Empty Set axiom, then we can say that there are also four semantic axioms, which establish the empty set, the ranges of functions, the domains of functions, and the infinite set of natural numbers. I find interesting to ask how the six syntactic axioms might be understood as distinguishing pairs of the four semantic axioms. Philosophically, this type of structure appears, for example, in the Ten Commandments. Four positive commandments instruct us what to do in order to love God, and six negative commandments instruct us what not to do in order to love our neighbors as ourselves.
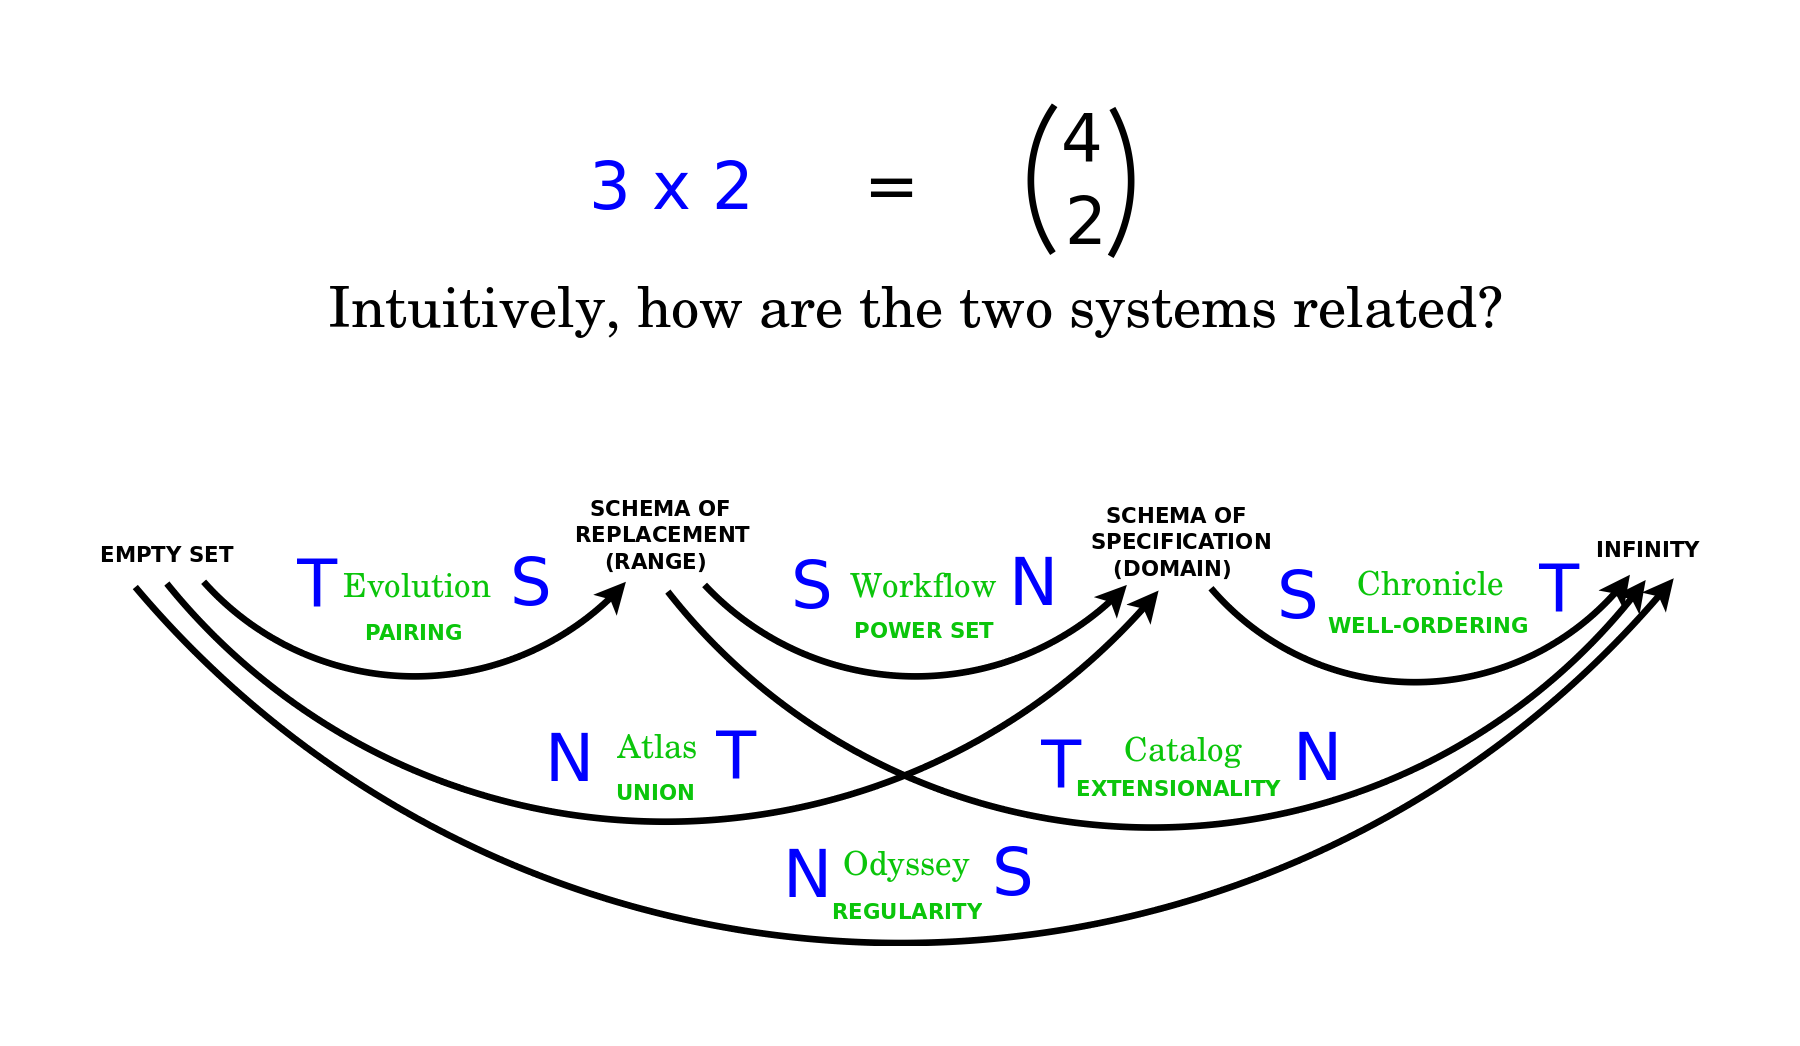
I find it exciting to arrive at the same structure from different points of view. But it's a challenge to understand intuitively how and why they fit together or perhaps to conclude that they do not. It's an open question for me to understand how the six visualizations might be distinguishing pairs taken from four levels of knowledge.
The lesson that I take from my study of visualizations and paradoxes is that they all sustain the same gap between the original, overwhelming, primary structure and the subsequent, manageable, secondary structure. The primary structure may consist of billions of facts in the world or in our brain, whereas the secondary structure may consist of a dozen vantage points from which we can ask our questions. The visualizations let us conflate the two structures seemlessly, but the paradoxes remind us of the inherent mental illusions. The point of this all is that the various visualizations may yet sustain the same gap. Absolute truth is not in what our minds see, but in the gap between what we know and what we don't know.